
BlueQuesday Tips
BlueQ Tip #1: Status Definitions
I’d like to introduce myself. I’m the Director of Customer Experience at BlueBin. Starting today, I will be sending a short email once a week highlighting a section of the BlueQ Dashboard that will be a helpful review or potentially a new tip you might not be aware of yet. I especially look forward to a video series we have planned with 30-60 second screen sharing clips that will walk through each portion of the BlueQ Software reporting capabilities!
To kick things off, I wanted to go over a quick reminder of the most fundamental definitions of BlueQ Kanban software: Bin/Item Status.
| Critical | Bin or Item is being used much faster than the rate it's planned for. (Par likely needs to be increased immediately) |
| Hot | Bin or Item is moving slightly faster than planned. (Consider increasing Par if Bin or Item is regularly in this status) |
| Healthy | Par for this Bin or Item is correct and is being used and replenished at the optimal rate. |
| Slow | Bin or Item hasn’t been ordered in several months. (Consider decreasing Par to increase storage space and decrease waste) |
| Stale | Bin or Item hasn’t been ordered for a prolonged period. (Reassess if this product is truly needed in its current location, remove or lower Par) |
Over the next few weeks, I’ll review each status in more detail and discuss best practices for optimizing your supply chain daily. Please feel free to reach out to me with any questions regarding these definitions or other BlueQ Analytics matters!
BlueQ Tip #2: Critical & Hot
For today’s tip, I’d like to dig a little deeper into two of the Optimization Statuses I defined last week. I’ve included them again below for reference:
| Critical | Bin or Item is being used much faster than the rate it's planned for. (Par likely needs to be increased immediately) |
| Hot | Bin or Item is moving slightly faster than planned. (Consider increasing Par if Bin or Item is regularly in this status) |
Converting Bins or Items from one of these two statuses to Healthy is the best way to make immediate strides toward optimizing your supply chain. The BlueBin algorithm provides a Suggested Bin Quantity column for each item.
- Critical Items must be managed daily and may change throughout the year. For example, certain supplies fly off the shelves quicker during RSV season and need the Par to be higher here than during other periods.
- Hot Bins are still being ordered quicker than expected but are not as crucial to manage. Supply Chain Specialists and Managers should address changing the Par for these Bins as they have time throughout the week.
Increasing the Par for these Bins or Items to the suggested quantity will get them closer to a Healthy status, reducing Stat Calls and Stockouts in your supply rooms. This will ensure supplies are on hand when medical professionals need them, ultimately reducing supply chain costs across our organizations.
BlueQ Tip #3: Slow & Stale
Last week we dove deeper into our algorithm's Critical and Hot status indicators. Today we will look closer at the status indicators on the other side of Healthy: Slow & Stale. I’ve included the definitions below as a refresher.
| Slow | Bin or Item hasn’t been ordered in several months. (Consider decreasing Par to increase storage space and decrease waste) |
| Stale | Bin or Item hasn’t been ordered for a prolonged period. (Reassess if this product is truly needed in its current location; remove or lower Par) |
These two categories are likely items that are either overstocked, underused, or unnecessary in your supply rooms. These can hurt in two ways: 1) They take up valuable space that could be converted for other Items or Bins which are needed, and 2) Products with expirations that are not being used end up as a sunk cost, damaging the bottom line.
- Slow Items may or may not be a concern. It could be Slow due to sporadic high-volume use with ample time intervals. However, the Item may not be used as often as originally planned. Supply Chain Managers should review Pars semi-regularly to ensure appropriate quantities are utilized.
- Stale Bins commonly are products that were deemed necessary due to tribal knowledge or specific user desire. Data is showing these products are not required at the level predicted. Conversations should be held with medical staff to determine the viability of removing or reducing the Par.
By getting these Bins and Items to a Healthy status or removing them altogether, the supply nodes will be leaner and more streamlined. As you utilize the Slow and Stale indicators, you will realize significant dollar savings await your program. Another benefit of using BlueQ is to optimize the overall Supply Chain System!
BlueQ Tip #4: Slow & Stale, Part 2
I took screenshots highlighting a few items in your inventory currently in these states (once again, this email is only going to BlueQ Users in your organization). Reducing the current PAR to the “Suggested Par” (highlighted below) will enable you to streamline your supply procedures. This can also create more room in your supply nodes and prevent items from expiring. Enacting these changes across your nodes is one of the quickest ways to save costs in your organization.
- Select the Item Velocity Report from your Main Dashboard
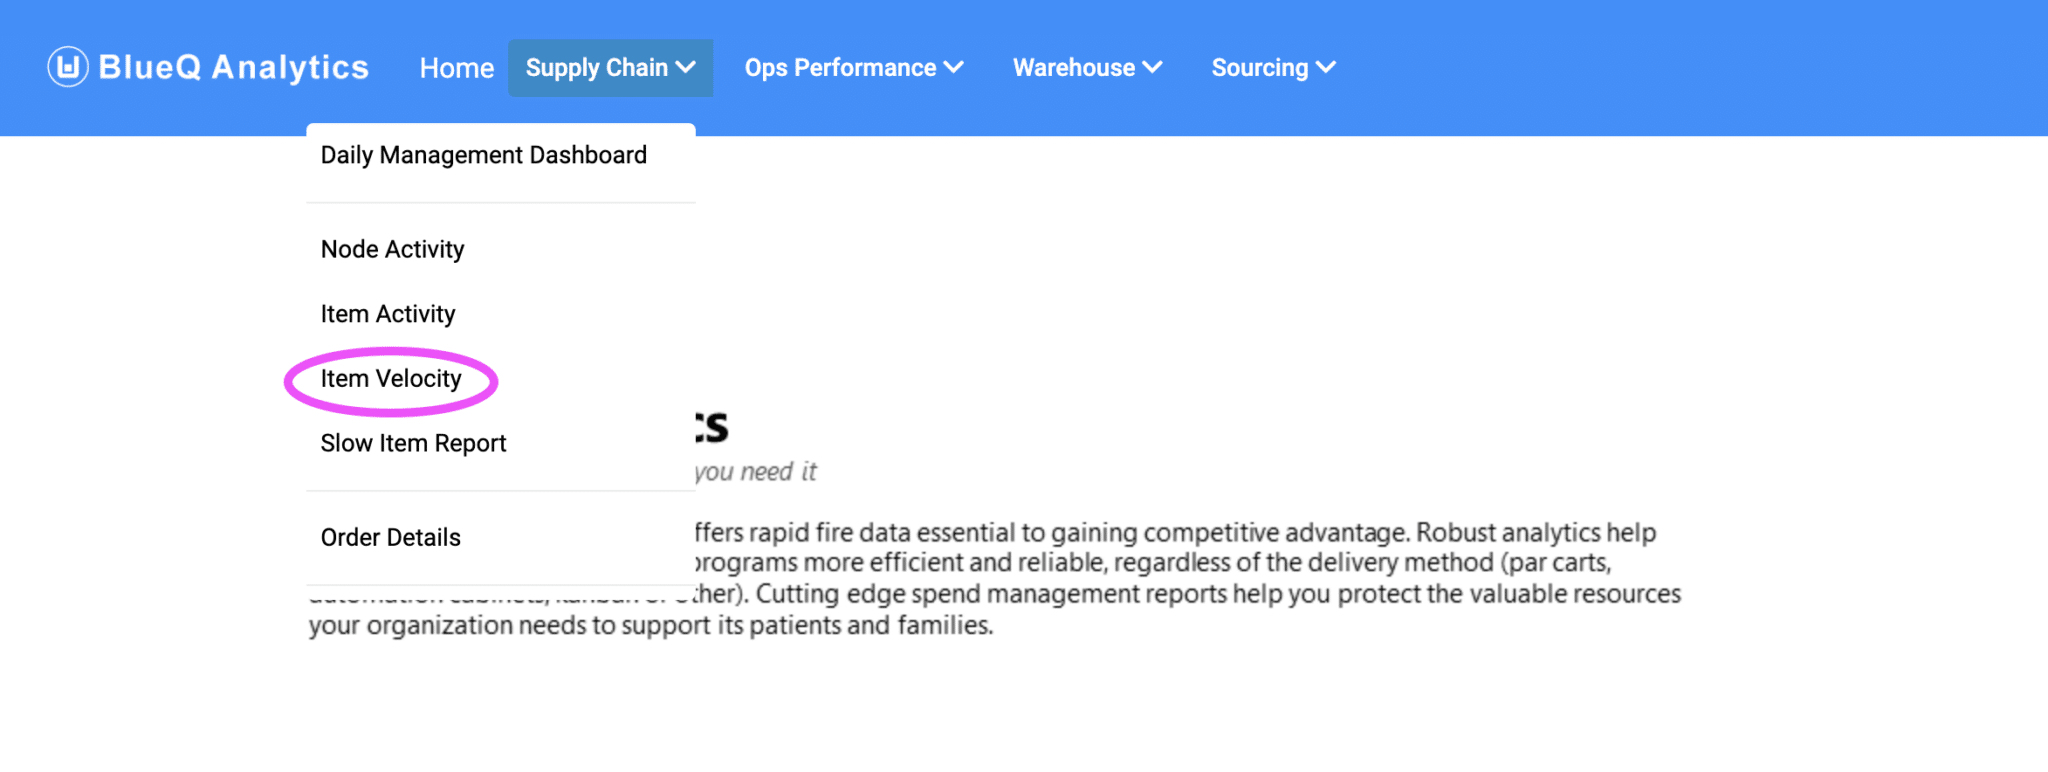
- In the Item Velocity Report, select the drop-down menu titled Item Status and check only the Slow and Stale options
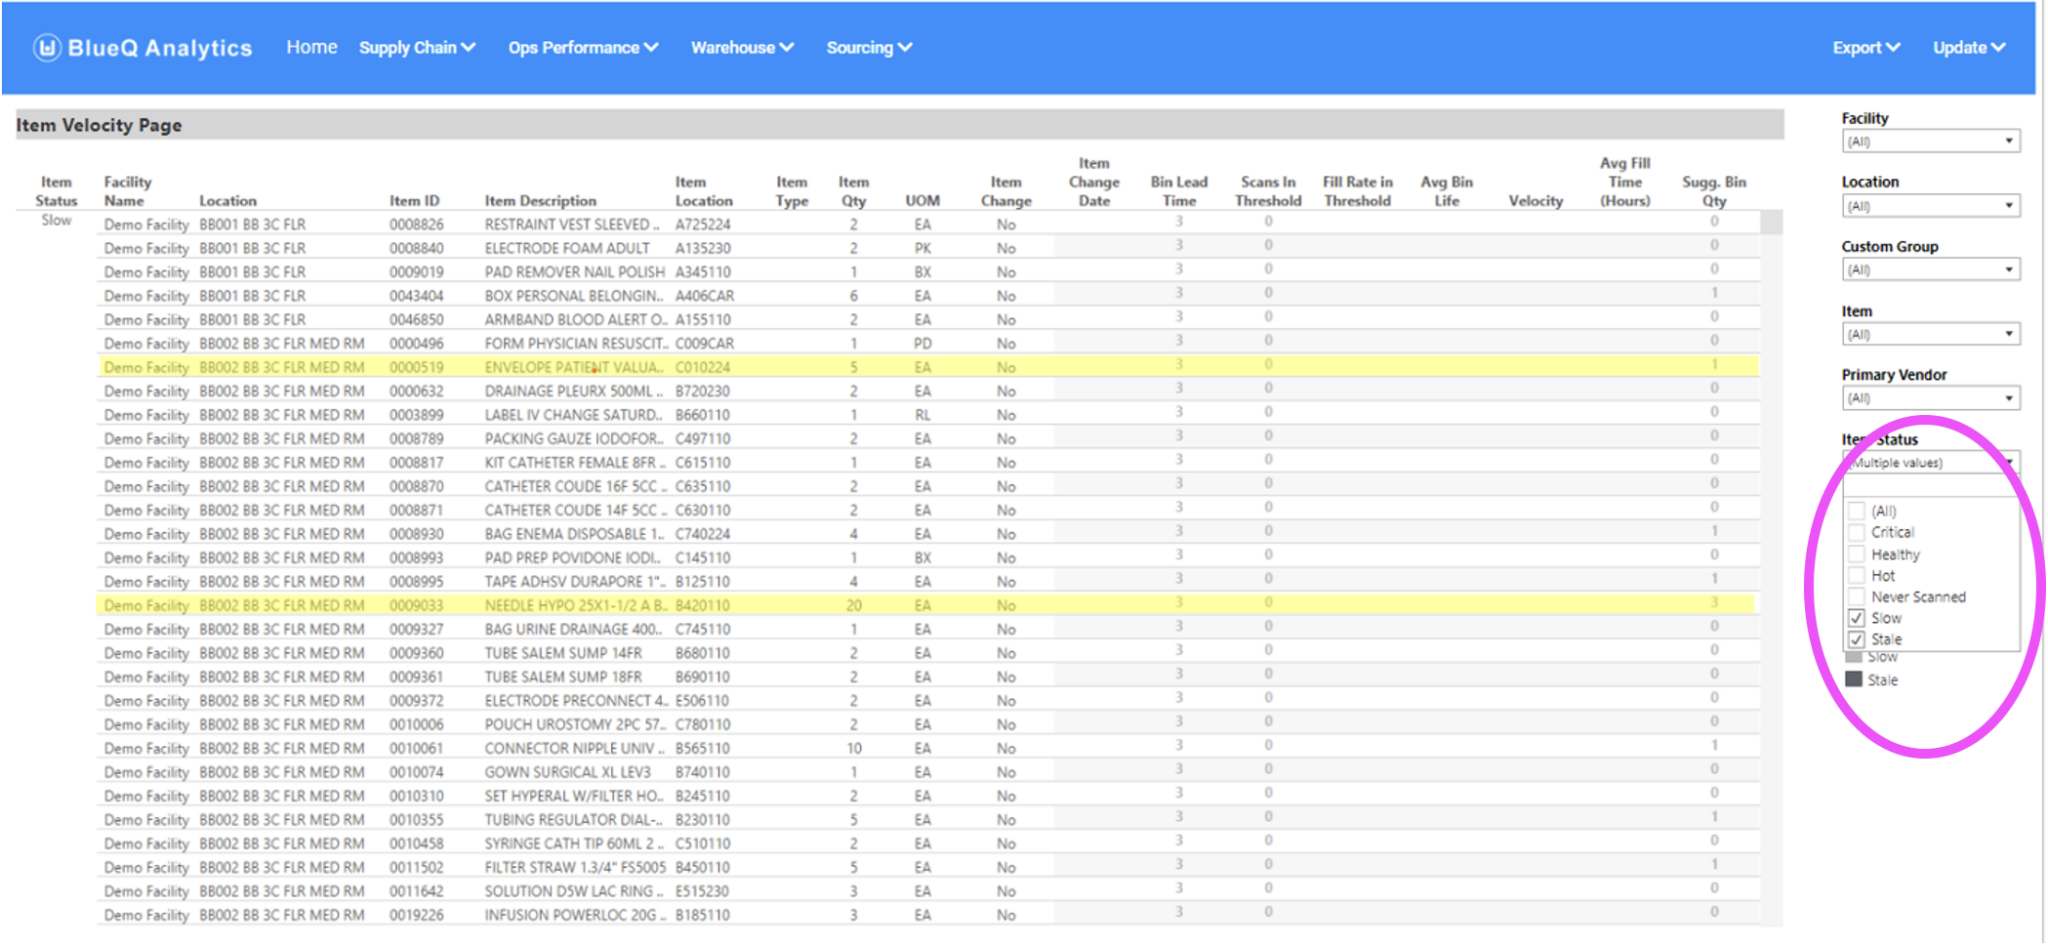
- I highlighted a couple of items that appear to have a bin quantity that is too high. Under the column header Item Qty, you can see the current PAR for one bin. For example: Needle Hypo A 25X 1-1/2ABEVEL has a current bin quantity of 20. Look to the right under the column header Sugg Bin Qty, and you’ll see our algorithm has determined the optimal bin quantity for this item is 3.
- The next step is crucial. A discussion should be held with the clinical leader and staff using that supply node (the node can be found under the column header Location) to determine if this item can be reduced. The PAR may be high because the item is not used often but is consumed in bunches when necessary. However, if this is not the case, reducing the PAR or removing the item will open space in the supply node and reduce the waste of unused items.
These are just a few items with high bin quantities and a lower Suggested Bin Quantity. Utilizing BlueBin’s algorithm to optimize these PARs and others in your supply nodes will streamline your supply chain and save your organization money and space!
One important note: once the par has changed, allow 30 days for our analytics to gather data. After 30 days, our algorithm will use the new data to update the Bin Status and provide a new Suggested Bin Quantity if still required to move the Bin to Healthy.
BlueQ Tip #5: Critical Items
Last week’s dive into more specifics got a lot of positive responses, so I wanted to do something similar this week but focusing on Critical Items. Like last week, we are looking individually at your hospital (not shared with the user group publicly) [Individual emails have been sent to separate organizations, this version only has data from the BlueBin Demo Dashboard].
I took screenshots highlighting a few items in your inventory currently in Critical status. These items are the most important ones to manage and should be reviewed daily by Supply Chain Managers. By Increasing the Par to the Suggested Bin Qty amount, you will ensure medical staff has supplies on hand when needed. This will reduce stockouts and Stat Calls, saving your organization money and work hours.
- Same as last week, select the Item Velocity Report from your Main Dashboard
- In the Item Velocity Report, select the drop-down menu titled Item Status and check only the Critical option</ br>
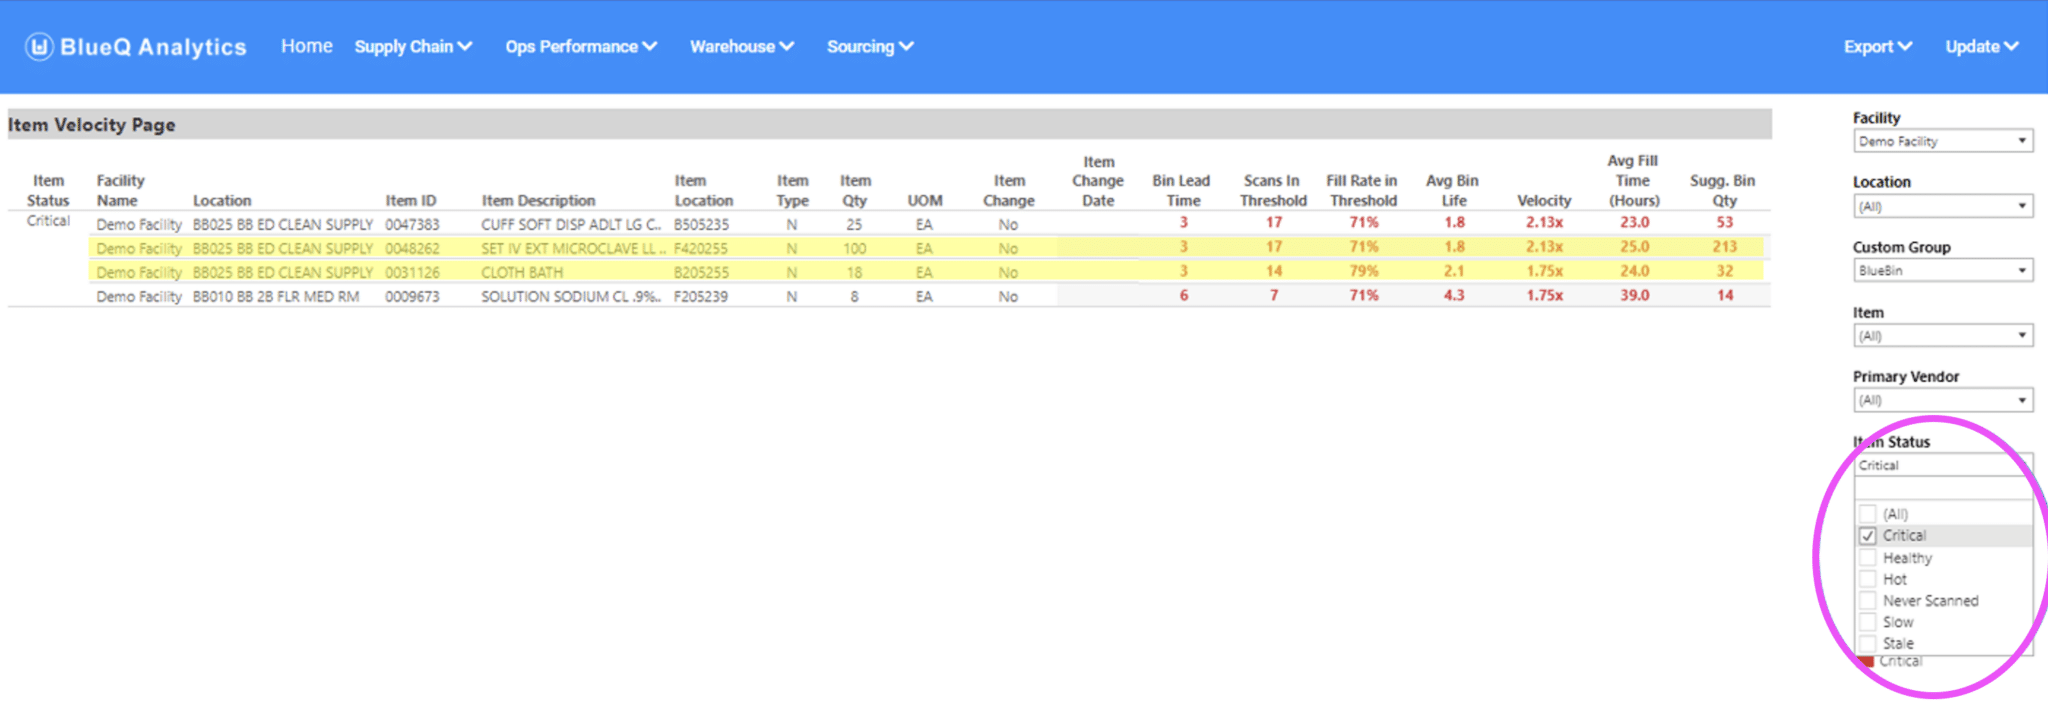
- I highlighted a few items with a bin quantity that is too low. Under the column header Item Qty, you can see the current PAR for one bin. For example, SET IV EXT MICROCLAVE LL 7IN has a current bin quantity of 100. Look to the right under the column header Sugg Bin Qty and see our algorithm has determined that the optimal bin quantity for this item is 213.
- These items are being utilized far more quickly than initially anticipated. Supply Chain Managers should immediately increase the PAR (a larger bin may be needed to accommodate the new PAR). The higher PAR will enable your Supply Specialists to focus on bins that are turning at a healthy rate and not lose time getting pulled away for Stat Calls. This will have a secondary effect of reducing stockouts, thereby increasing your overall supply chain efficiency.
Same important note: once the par has changed, allow 30 days for our analytics to gather data. After 30 days, our algorithm will use the new data to update the Bin Status and provide a new Suggested Bin Quantity if still required to move the Bin to Healthy.
BlueQ Tip #6: QCN Introduction
We’re switching gears today and discussing the QCN process. This is the Change Management Process within Kanban. By utilizing this system properly, you will ensure changes are effective and enable our analytics software to continue optimizing your supply chain.
QCN stands for Questions, Comments, and Needs. A box with these blank cards (fig. 1) should be in or near each supply node and available to all staff to fill out and submit to their manager for approval. Supply Chain Specialists should collect the cards from these boxes on a regular basis (weekly tends to work best) and pass them on to the BlueBelt or supervisor.
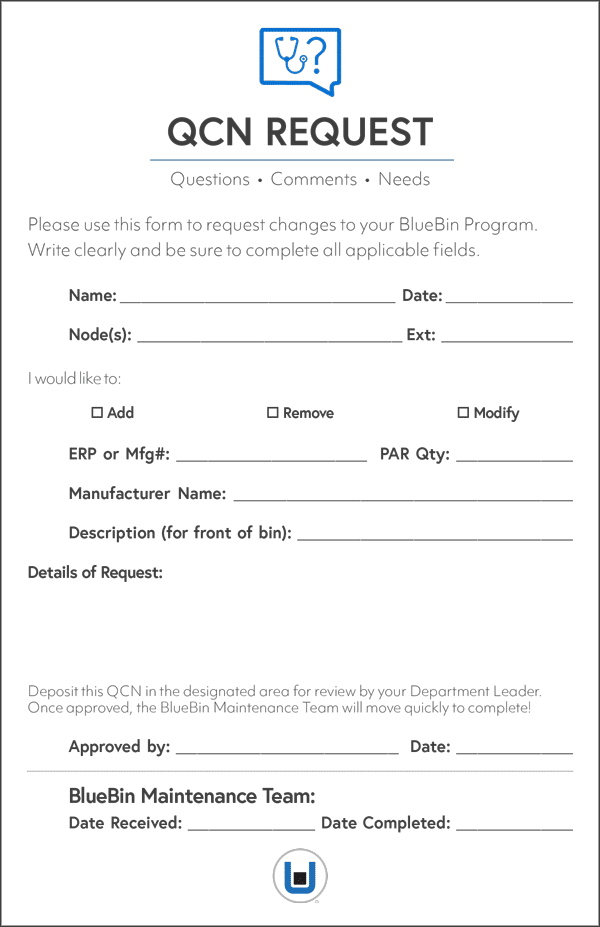
Fig. 1) QCN Request form
The next step in the QCN process is for a BlueBelt or supply chain leader to enter the card information into the BlueQ Analytics QCN Dashboard (if more info is needed, they should contact the originating clinical manager). Supervisors and BlueBelts will then process requests on a first-come, first-served basis unless marked urgent or otherwise.
Finally, the BlueBelt closes the request in the Dashboard, then emails the originating manager, informing them it was completed and closed. We will review the Dashboard over the next couple of weeks.
Some changes, such as rearranging bins for convenience, are simple and can be implemented immediately. Others can be more complicated and require meeting with clinical leadership to determine the best path forward. Falling behind on QCNs will result in the voice of the customer not being heard: please let us know if you’d like refresher training on the QCN Process!
BlueQ Tip #7: QCN Sample Form Fill
This week I’ve completed a sample form for a QCN. This is the first step in the Change Management Process and is completed by users at the clinical level. In the figure below, a clinical staff member has filled out a change request (in black ink) they’d like to see in the supply node. In this case, only Medium and XL gloves were in the node, which didn’t fit the user.
Support Sam is the name of our demo user/requestor today. He then took the request to his supervisor for approval (signature in blue ink) and placed the QCN Request card in the box or folder in the supply node.
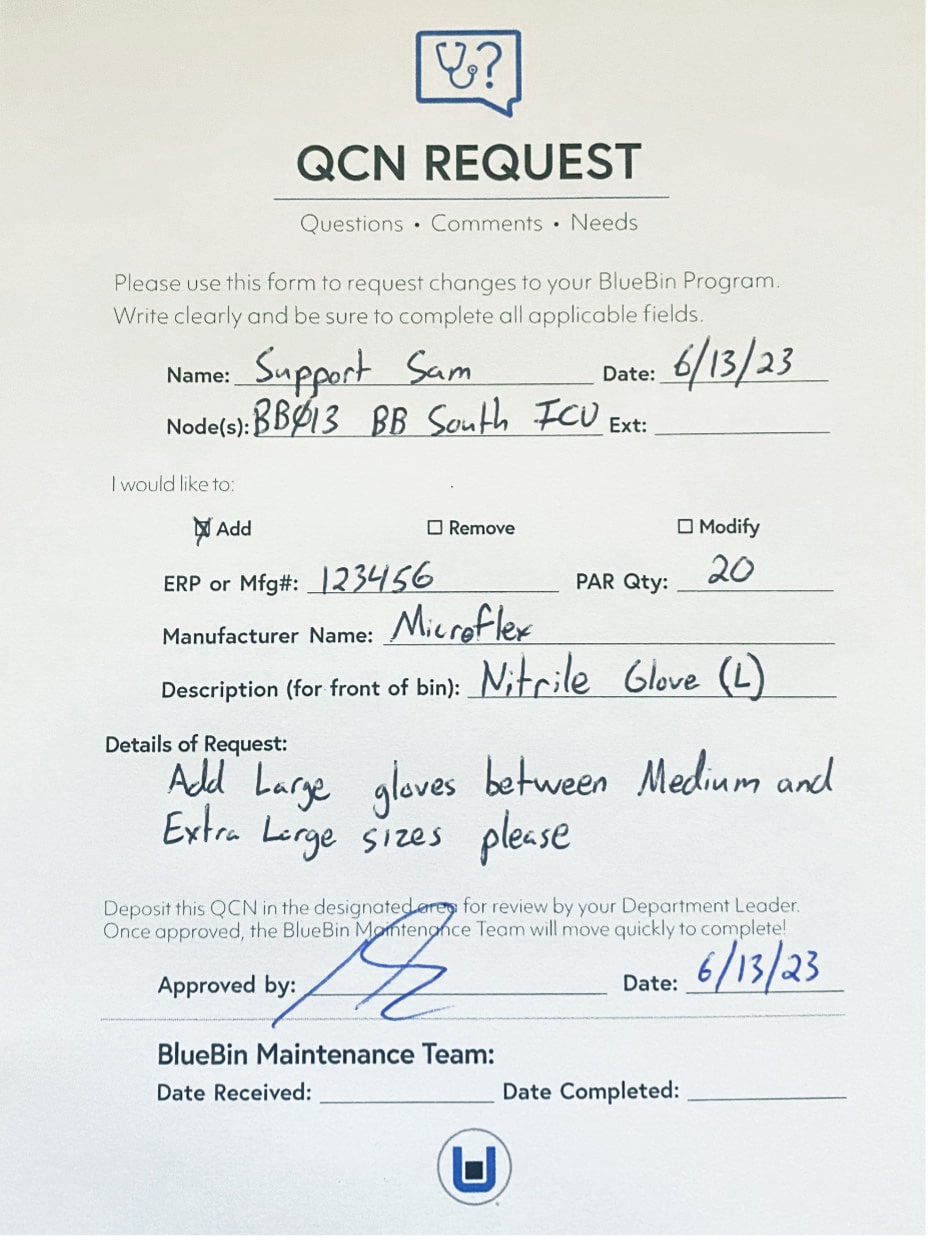
Fig. 1) Sample filled QCN Request form
Next, the Supply Tech Specialist will collect all QCN Request cards as part of their daily node maintenance and pass them onto the BlueBelt for processing. Next week we’ll use this example to demonstrate entering a QCN into BlueQ.
BlueQ Tip #8: QCN Entry
This week we’re reviewing how to respond to and process a QCN in the BlueBelt role. The QCN form from last week was provided to us originally by a clinical leader and then by a supply tech specialist. Our BlueBelt Certified hospital SCM team will input the request into BlueQ. Below is a screenshot of the BlueQ homepage. There are two options for starting a new QCN. You can choose the button highlighted in the middle of the entry screen, or the quickest way is to select the QCN Drop Down Menu on the left sidebar, then select New QCN Form.
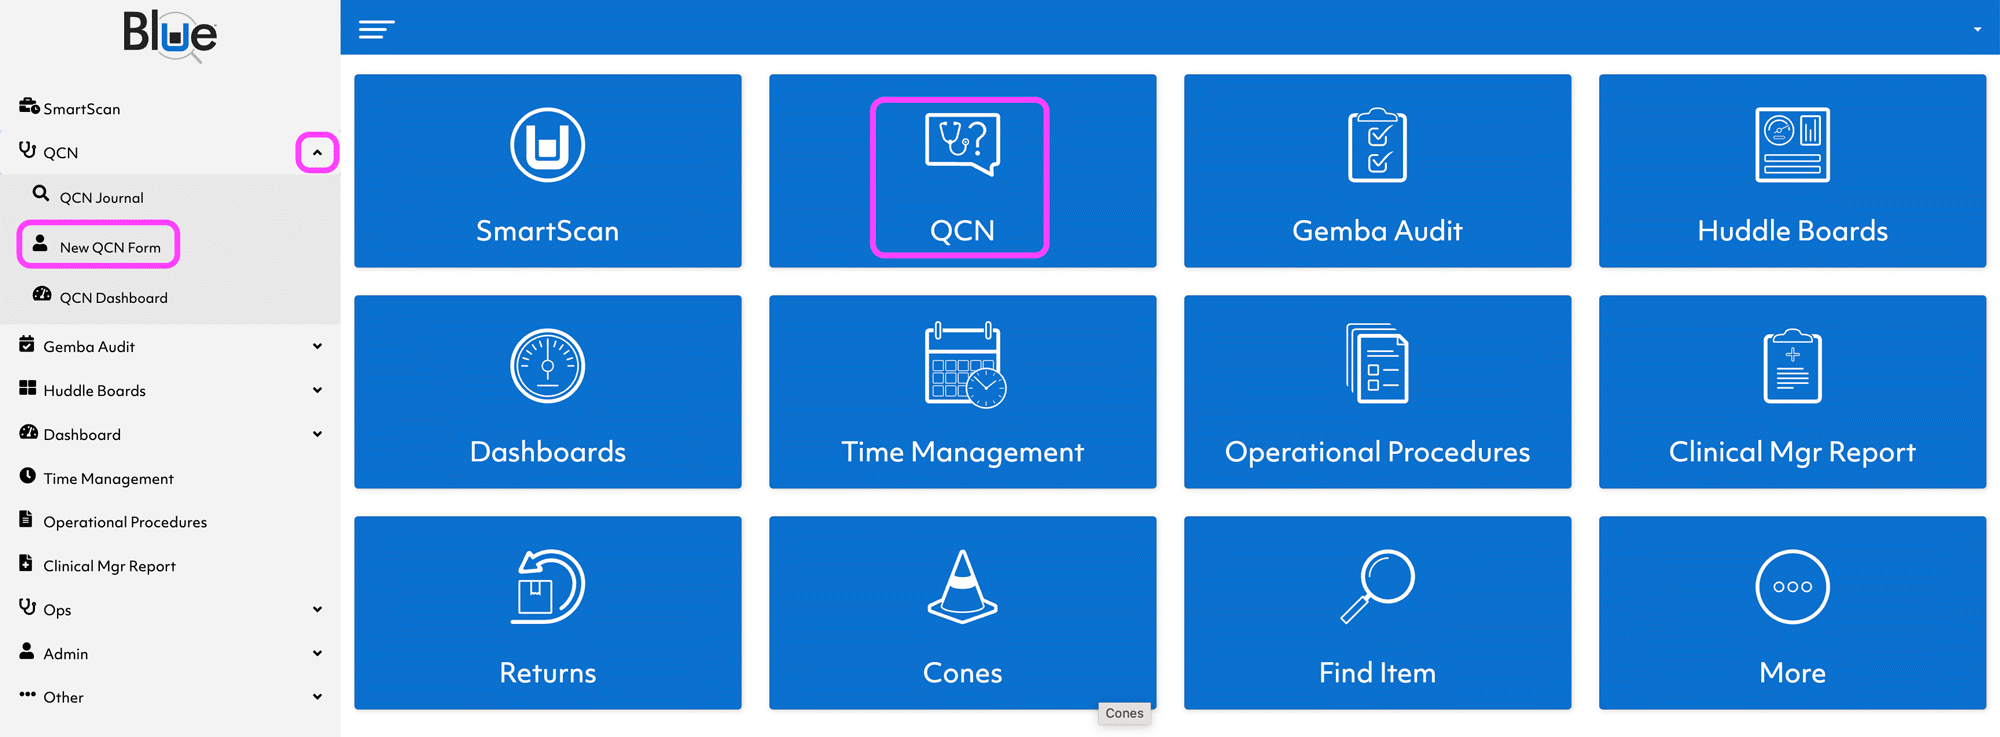
Fig. 1) How to find the New QCN form in BlueQ
This will take you to a blank version of the form. The BlueBelt will then use the data from the card to fill in drop-down menus and text boxes. See the screenshot below (fig. 2) that is filled out with the same info.
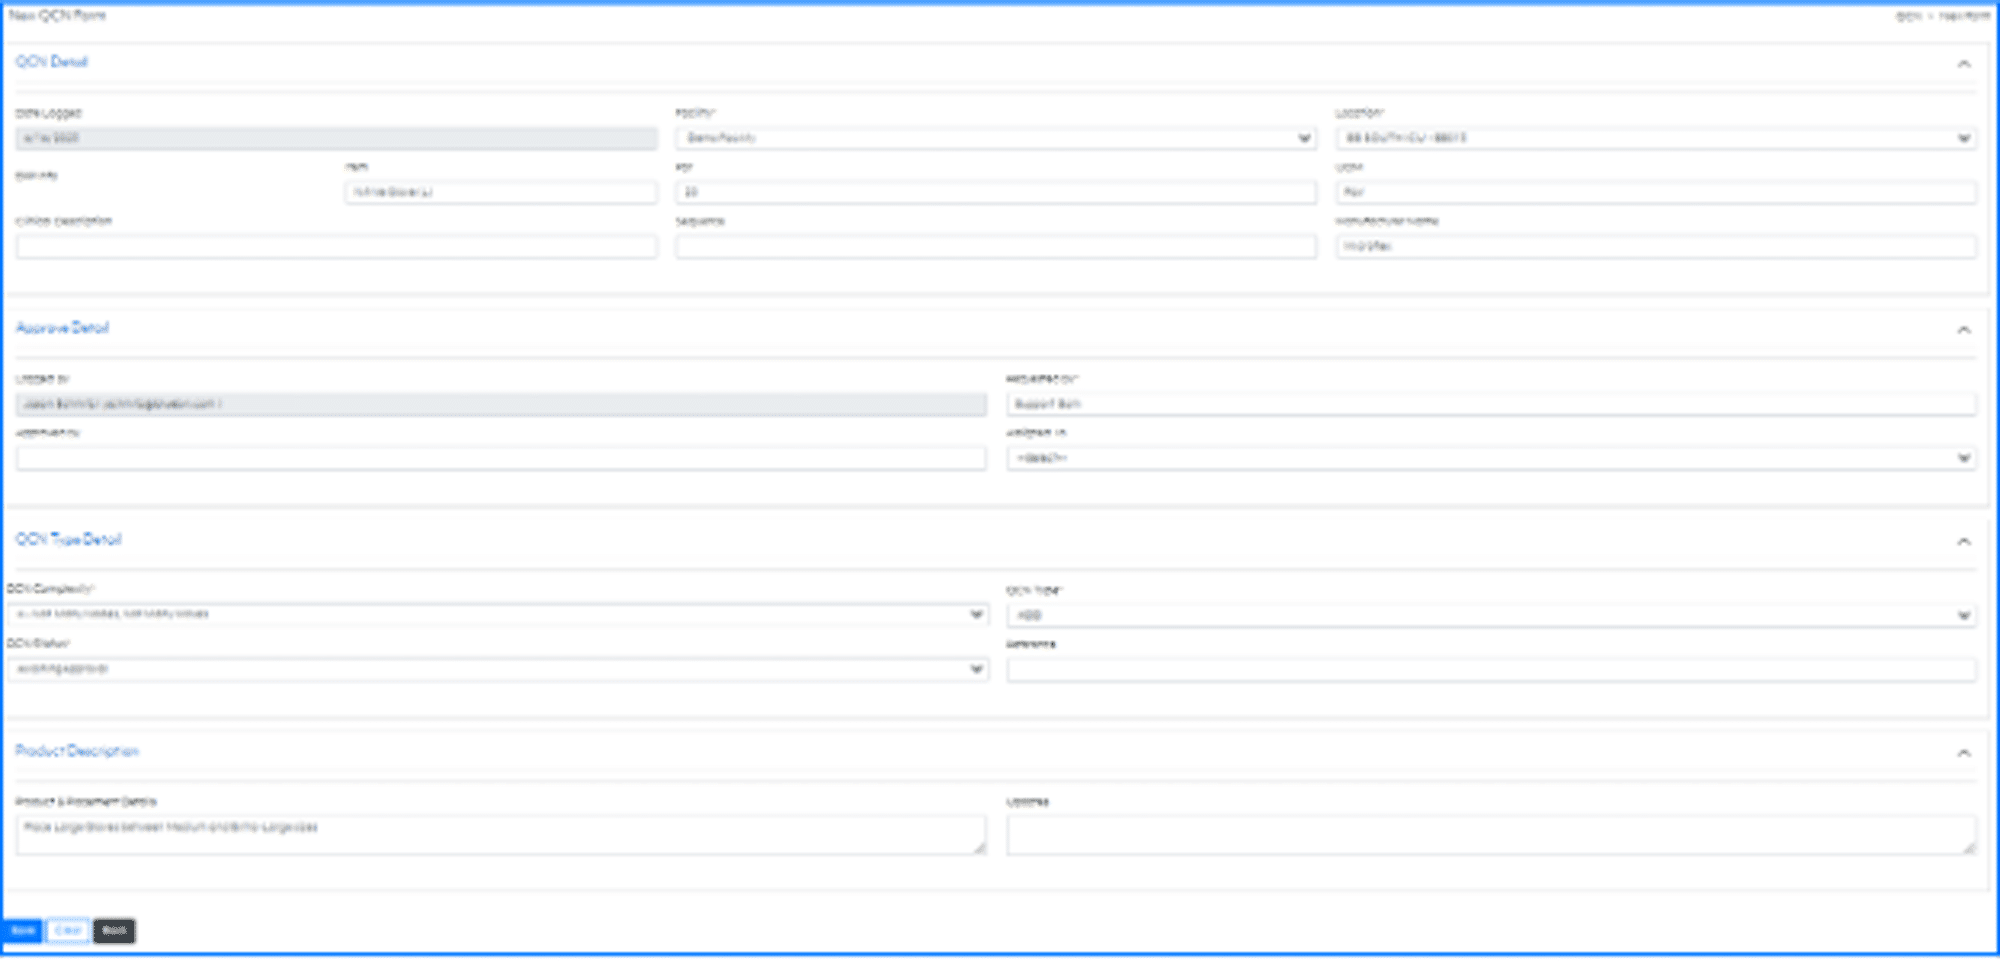
Fig. 2) New QCN form
Once the BlueBelt has filled out the online form. They will hit “Save” in the bottom left corner. The QCN is now added to the BlueQ system and will be processed according to clinical policy. Staying on top of QCNs ensures the customer’s voice is heard and not only assists in optimizing your supply chain but further enhances the trust between clinicians and their supply chain partners! Next week we’ll look at the QCN Dashboard in further detail.
BlueQ Tip #9: QCN Dashboard
Today we’re going to take another high-level look at the QCN Dashboard. QCNs, as you remember, are the clinician supply chain requests, Questions, Comments, and Needs.
You can access the QCN dashboard from the BlueQ Analytics Homepage using the QCN Button or through the drop-down menu in the left column. I’ve highlighted these options in the screenshot below:
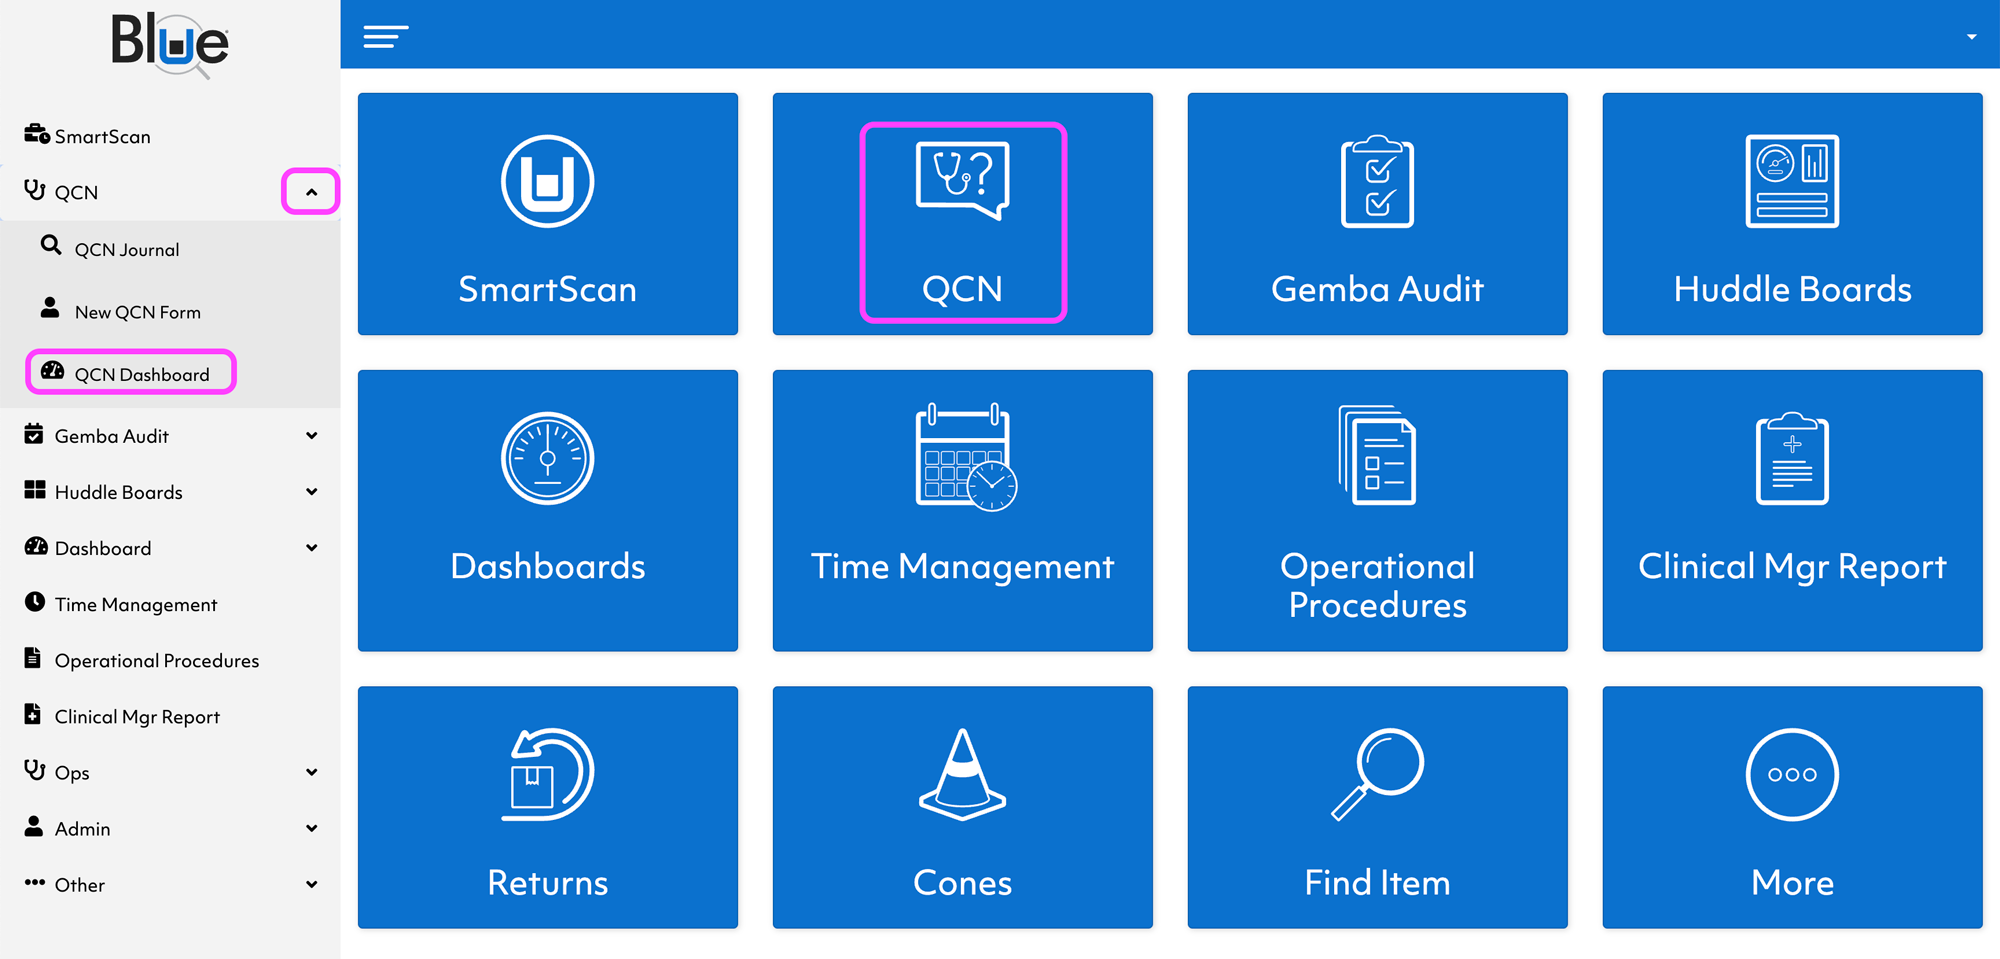
Fig. 1) Sample filled QCN Request form
The QCN Dashboard is a fantastic tool for keeping your supply chain optimized. By addressing the QCNs in a timely and efficient manner, you can ensure clinical staff has the supplies they need and keep supply nodes effective and serviceable.
The example below is from our Demo Dashboard. If you look at the top third of the dashboard, you’ll see a bar chart showing the total QCNs opened (Blue) and closed (Gray) for the given time period. Below that, I’ve highlighted the drop-down filters; these will let you drill down into specific facilities and areas or let you sort QCNs by priority, user, and item.
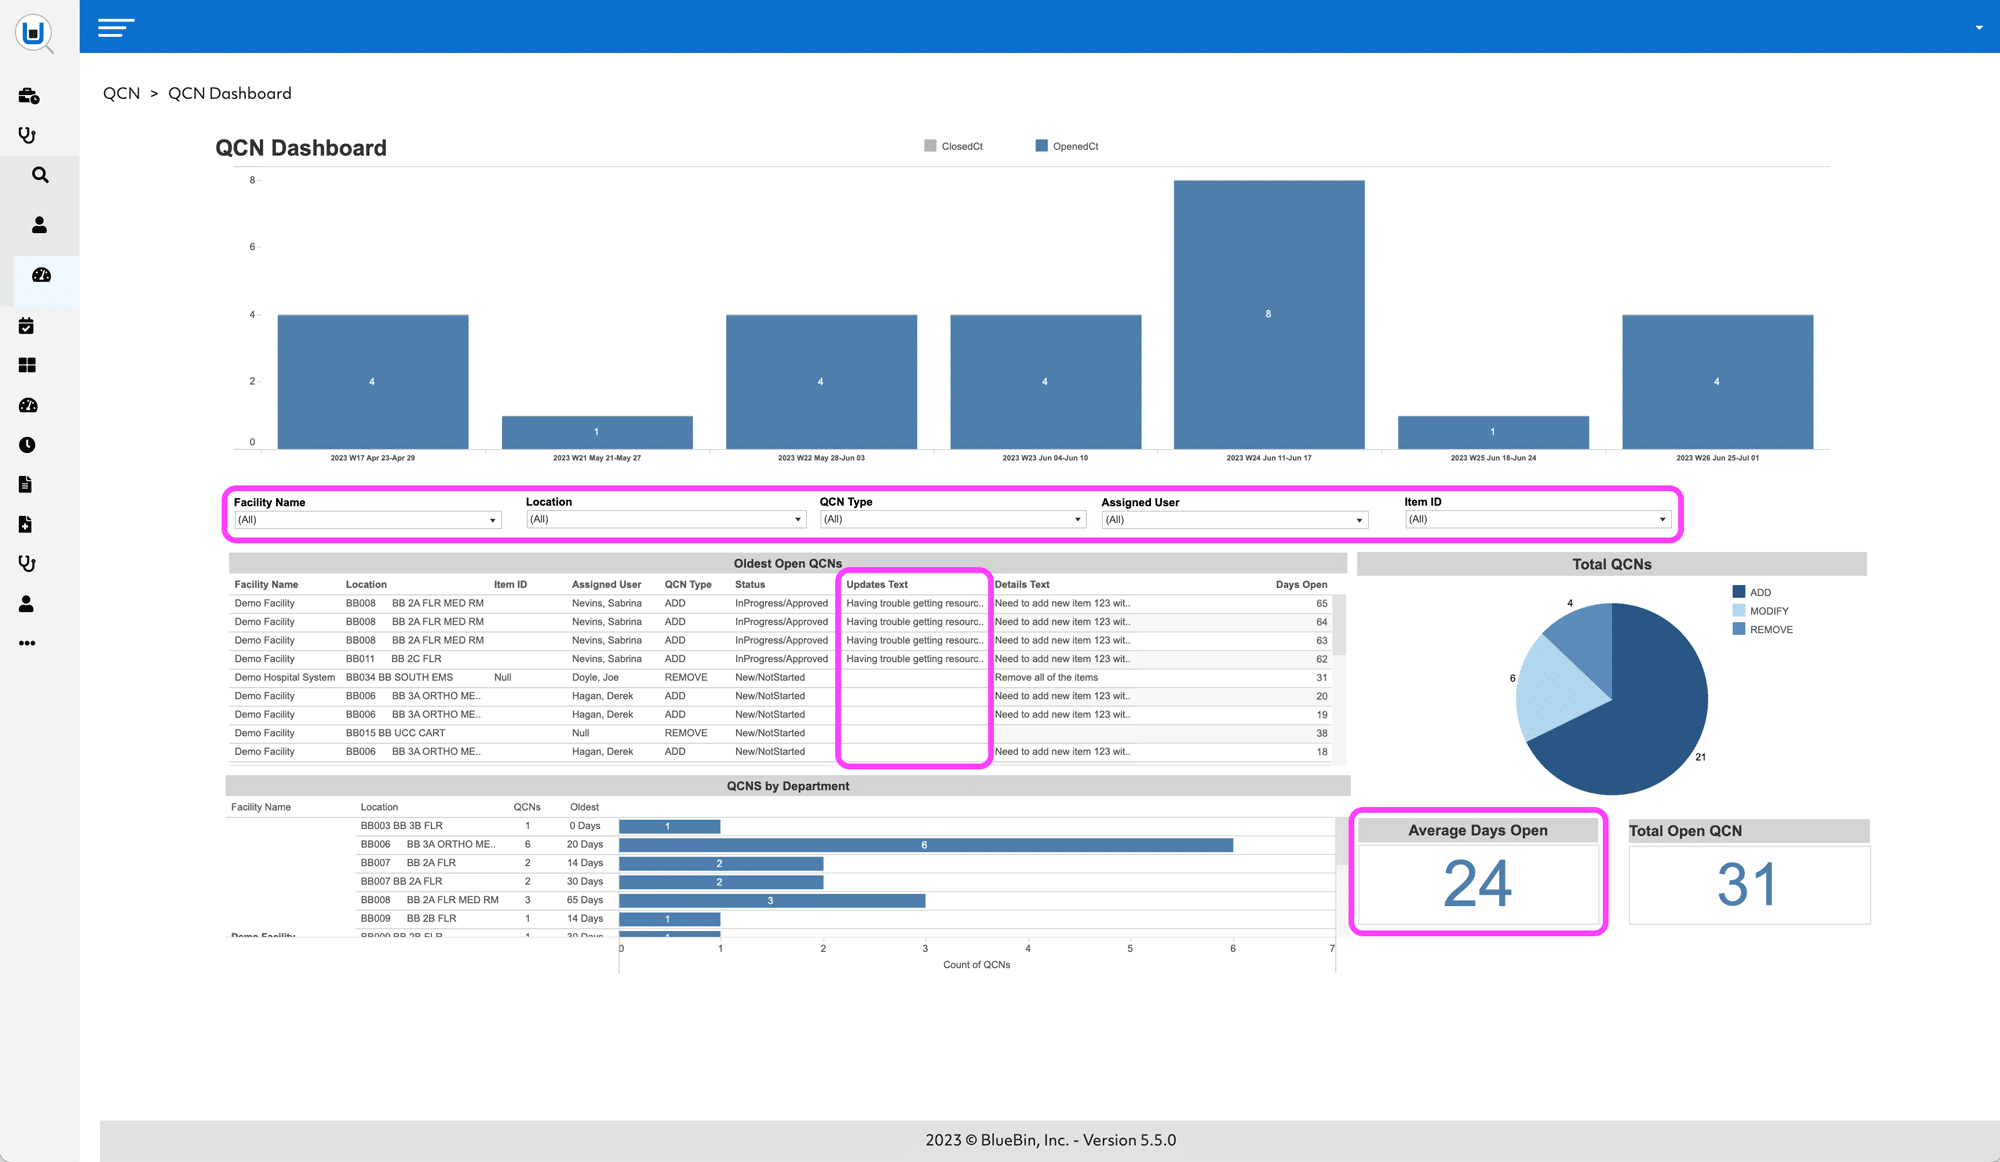
Fig. 2) QCN Dashboard detail page
Continuing down the dashboard, you’ll see the Oldest Open QCNs report and Average Days Open. We’ve found it is best practice to keep Average Days Open under 30 days. This fosters trust and helps build relationships with clinical staff, as they know their voice is being heard. Whenever possible, if a QCN will remain open for an extended period (due to a backorder, a delayed part, etc), the BlueBelt should go in and describe the cause of the delay in the Updates section of the QCN (highlighted in the center).
BlueQ Tip #10: QCN Journal
Today we’re going to take another high-level look at the QCN Dashboard. QCNs, as you remember, are the clinician supply chain requests, Questions, Comments, and Needs.
You can access the QCN dashboard from the BlueQ Analytics Homepage using the QCN Button or through the drop-down menu in the left column. I’ve highlighted these options in the screenshot below:
Fig. 1) How to find QCN Journal in BlueQ Analytics
The QCN Journal lists all QCNs for your organization. You can use the dropdown menu to filter specific data. There are also links to go to the QCN Dashboard or create a New QCN Form. From both the Journal and the Dashboard, you can export data (highlighted in the green box, upper right).
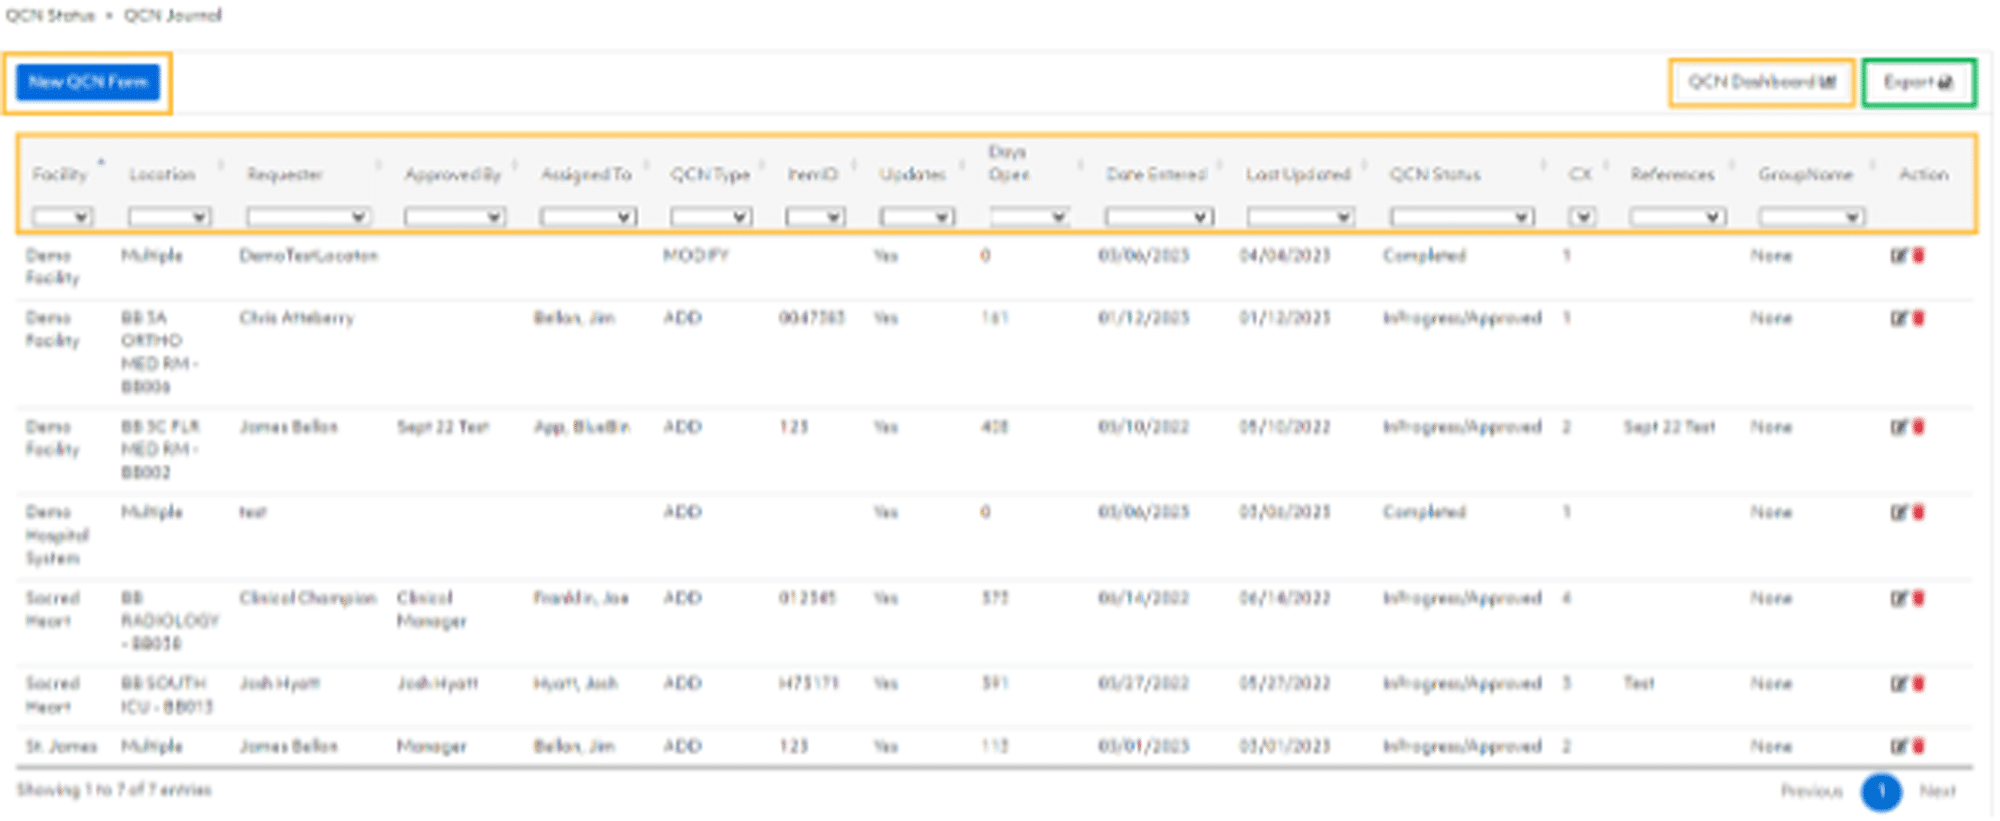
Fig. 2) BlueQ QCN Journal
BlueQ Tip #11: Gemba Audits Intro
Typically, this process involves four steps:
- Planning
- Preparation
- Observation
- Follow-up
BlueQ software supports all phases but is especially helpful for the final two. In the observation phase, leaders inspect supply nodes on a BlueQ-organized schedule to ask questions, record notes, and pictures, and identify areas for improvement.

Gemba
Observe-Recognize-Communicate-Analyze-Solve the Problem
The follow-up phase involves analyzing the data collected during the audit, identifying the root causes of any problems observed, and developing an action plan to address the issues. Trends that are negatively impacting the overall supply chain can be identified and corrected through consistent Gemba Audits. Over the next couple of weeks, we’ll go over how to conduct an audit using BlueQ Analytics.
BlueQ Tip #12: How Often to Conduct Gemba Audits
All supply chain individuals conduct Gemba Audits on a varying schedule based on the tier of auditing inspector. Regardless of the Tier, all audits should be conducted in a standard method. The person conducting the audit inspects the node using a printed audit form or a handheld device with the BlueQ Analytics: Gemba Audit-Standard online form.
Tier 1 individuals include supply chain specialists, BlueBelts, and line managers. A Gemba Audit of each node should be conducted monthly.
Tier 2 includes Supply Chain Managers and Clinical Sponsors. These individuals should be conducting audits of each node quarterly.
Tier 3 is comprised of C-Suite and VP-level individuals involved in the supply chain. It is important that they conduct Gemba Audits throughout the year and inspect each node at least once annually.
During the Gemba Audit, the inspector will look for things like empty bins not placed on the top rack, back bins that have not been pulled forward, expired items, proper labeling, and general cleanliness. Next week, we’ll review the actual Gemba Audit form in more detail!
BlueQ Tip #13: New Gemba Audit Form
This week we’re completing a sample Gemba Audit Form. I’ve provided screenshots below for accessing the form in BlueQ and the filled-out form itself.
The individual conducting the Gemba Audit can either use a handheld and directly fill the form out in the app, or they can use a printed form during the audit and complete the online form back at their desk.
From the Home Page of the BlueQ Dashboard, there are two ways to access the Gemba Audit Form. You can click the Gemba Audit button and New Gemba Audit Standard from the next page. However, it is quicker to use the drop-down menu on the left and select Gemba Audit-Standard, which will take you directly to the form. Both options are boxed in magenta (Fig 1).
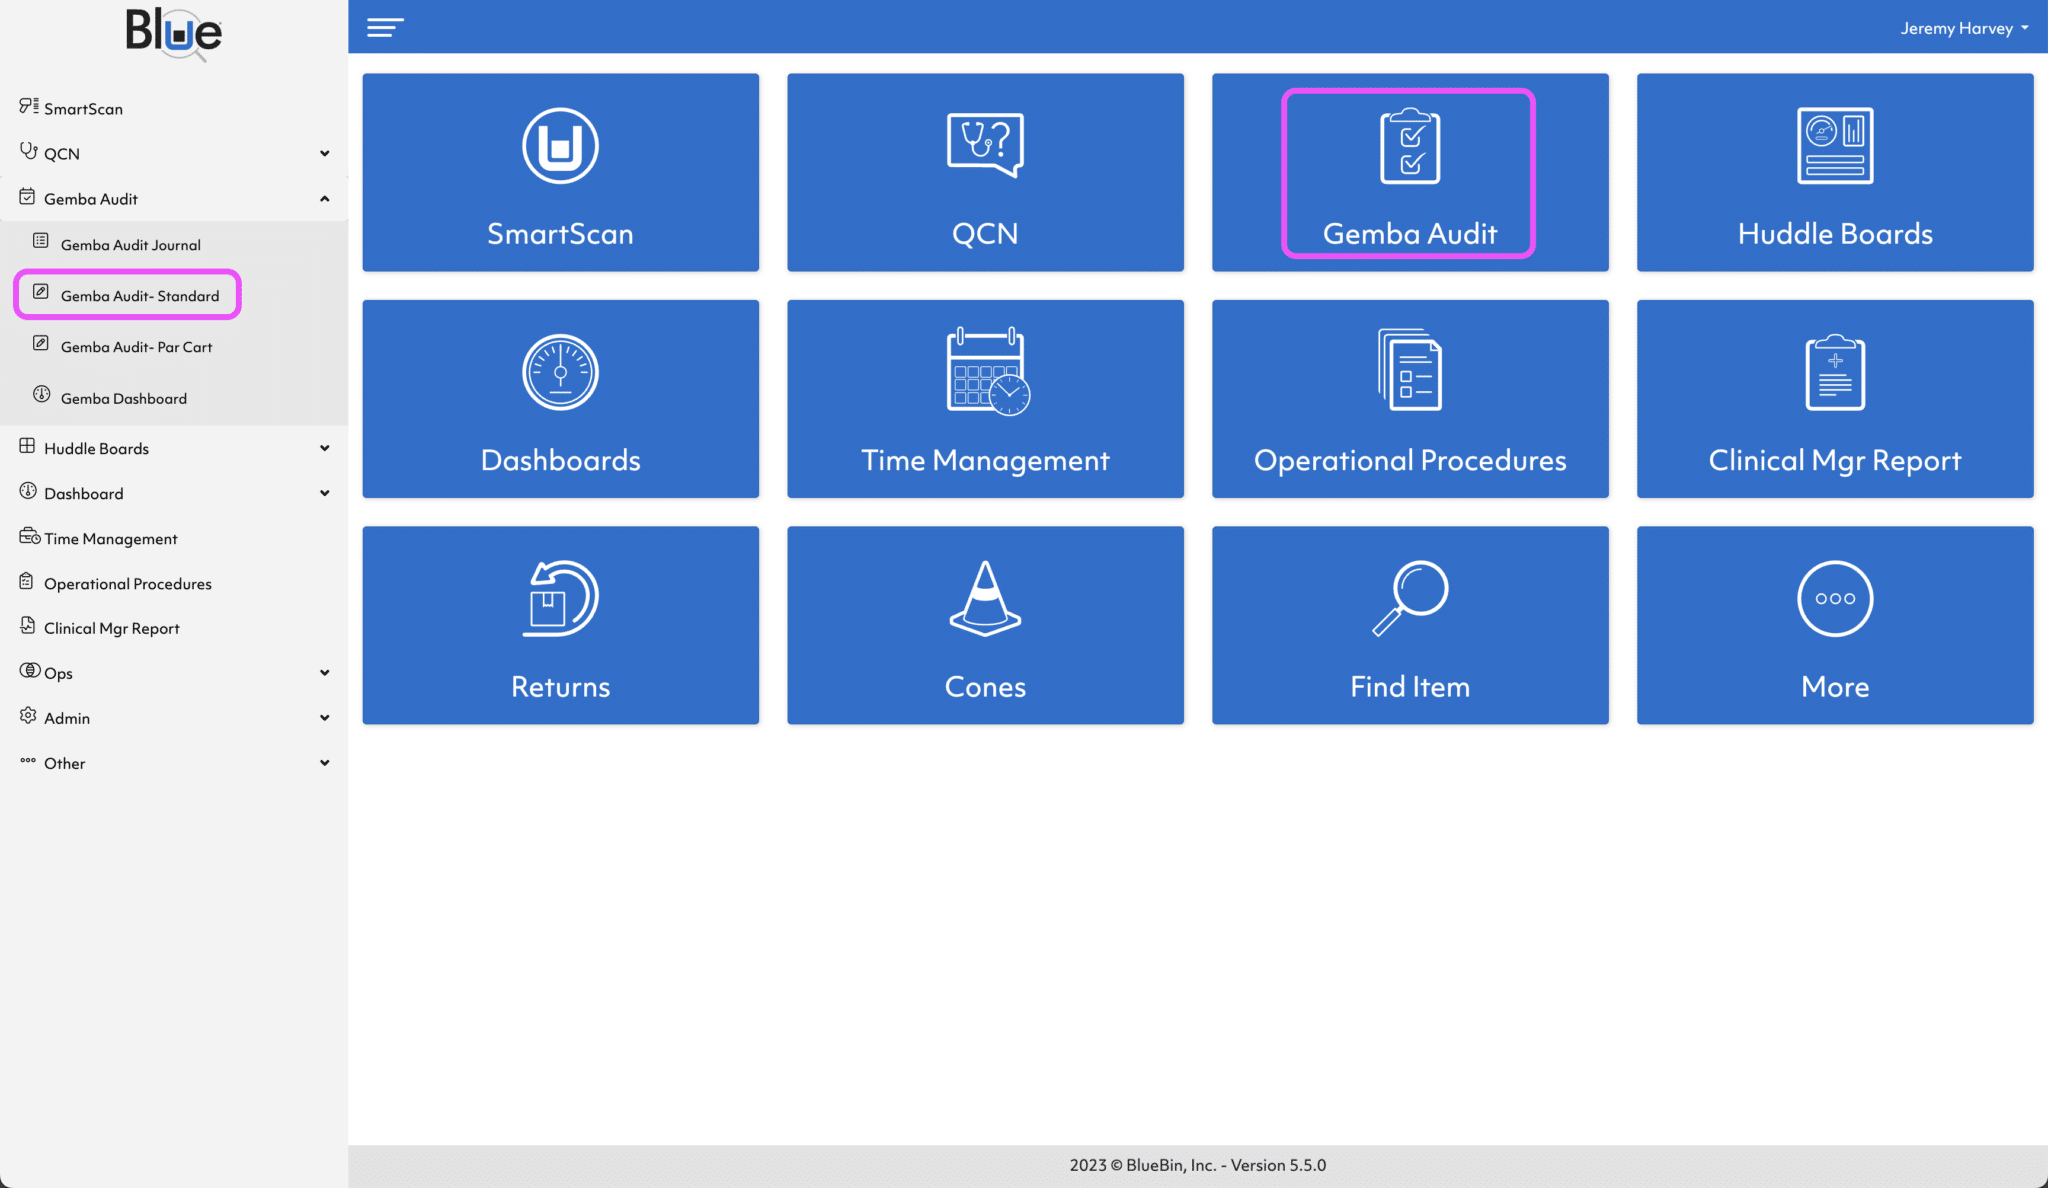
Fig. 1) Where to find Gemba Audit Form in BlueQ
The following two images show a filled-out Gemba Audit Form. It is important to remember that these audits are only as good as the effort applied to them.
You’ll see I circled the comments sections in yellow (Fig. 2). By filling these out in detail, you will be able to see trends in your supply nodes and more effectively optimize your overall SCM process.
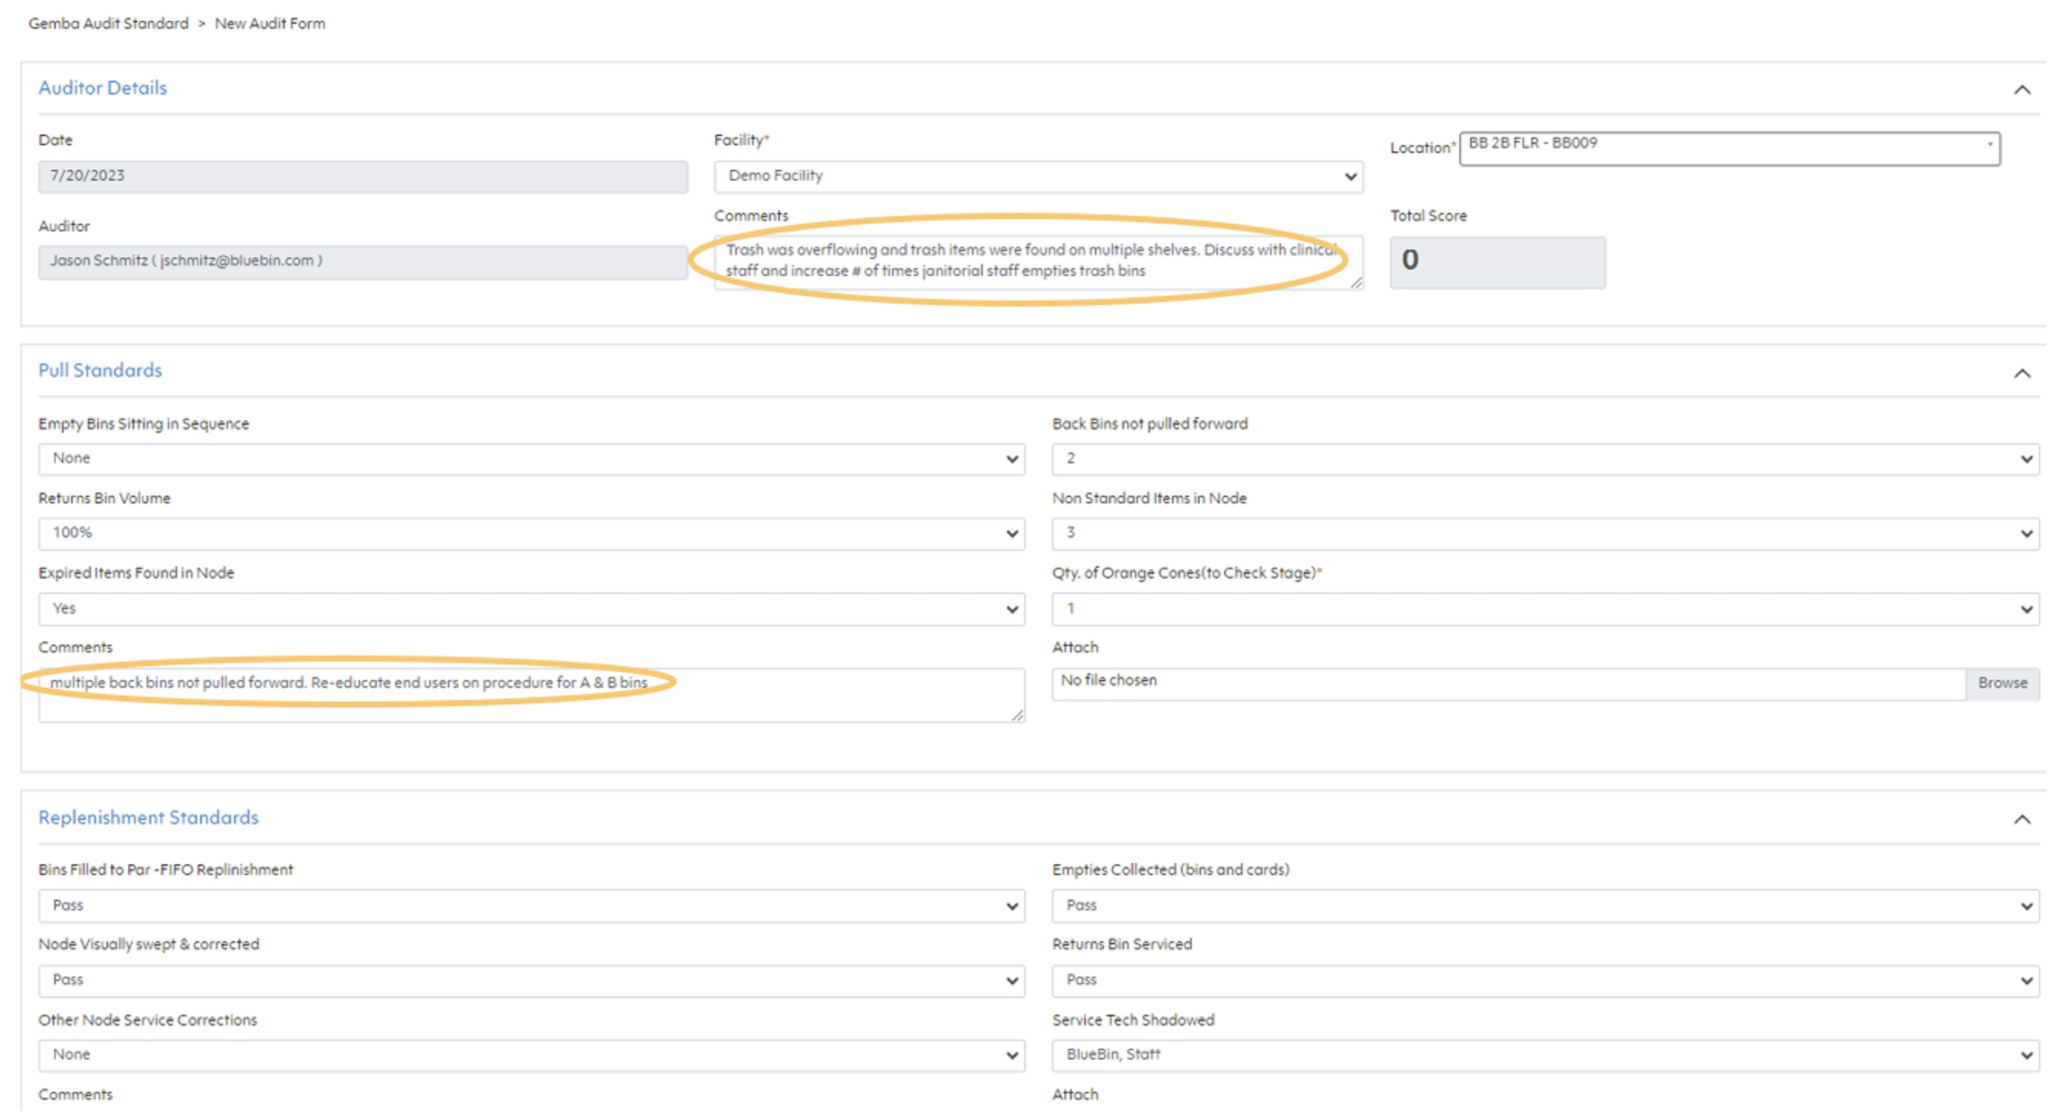
Fig. 2) New Gemba Audit form with comments sections circled
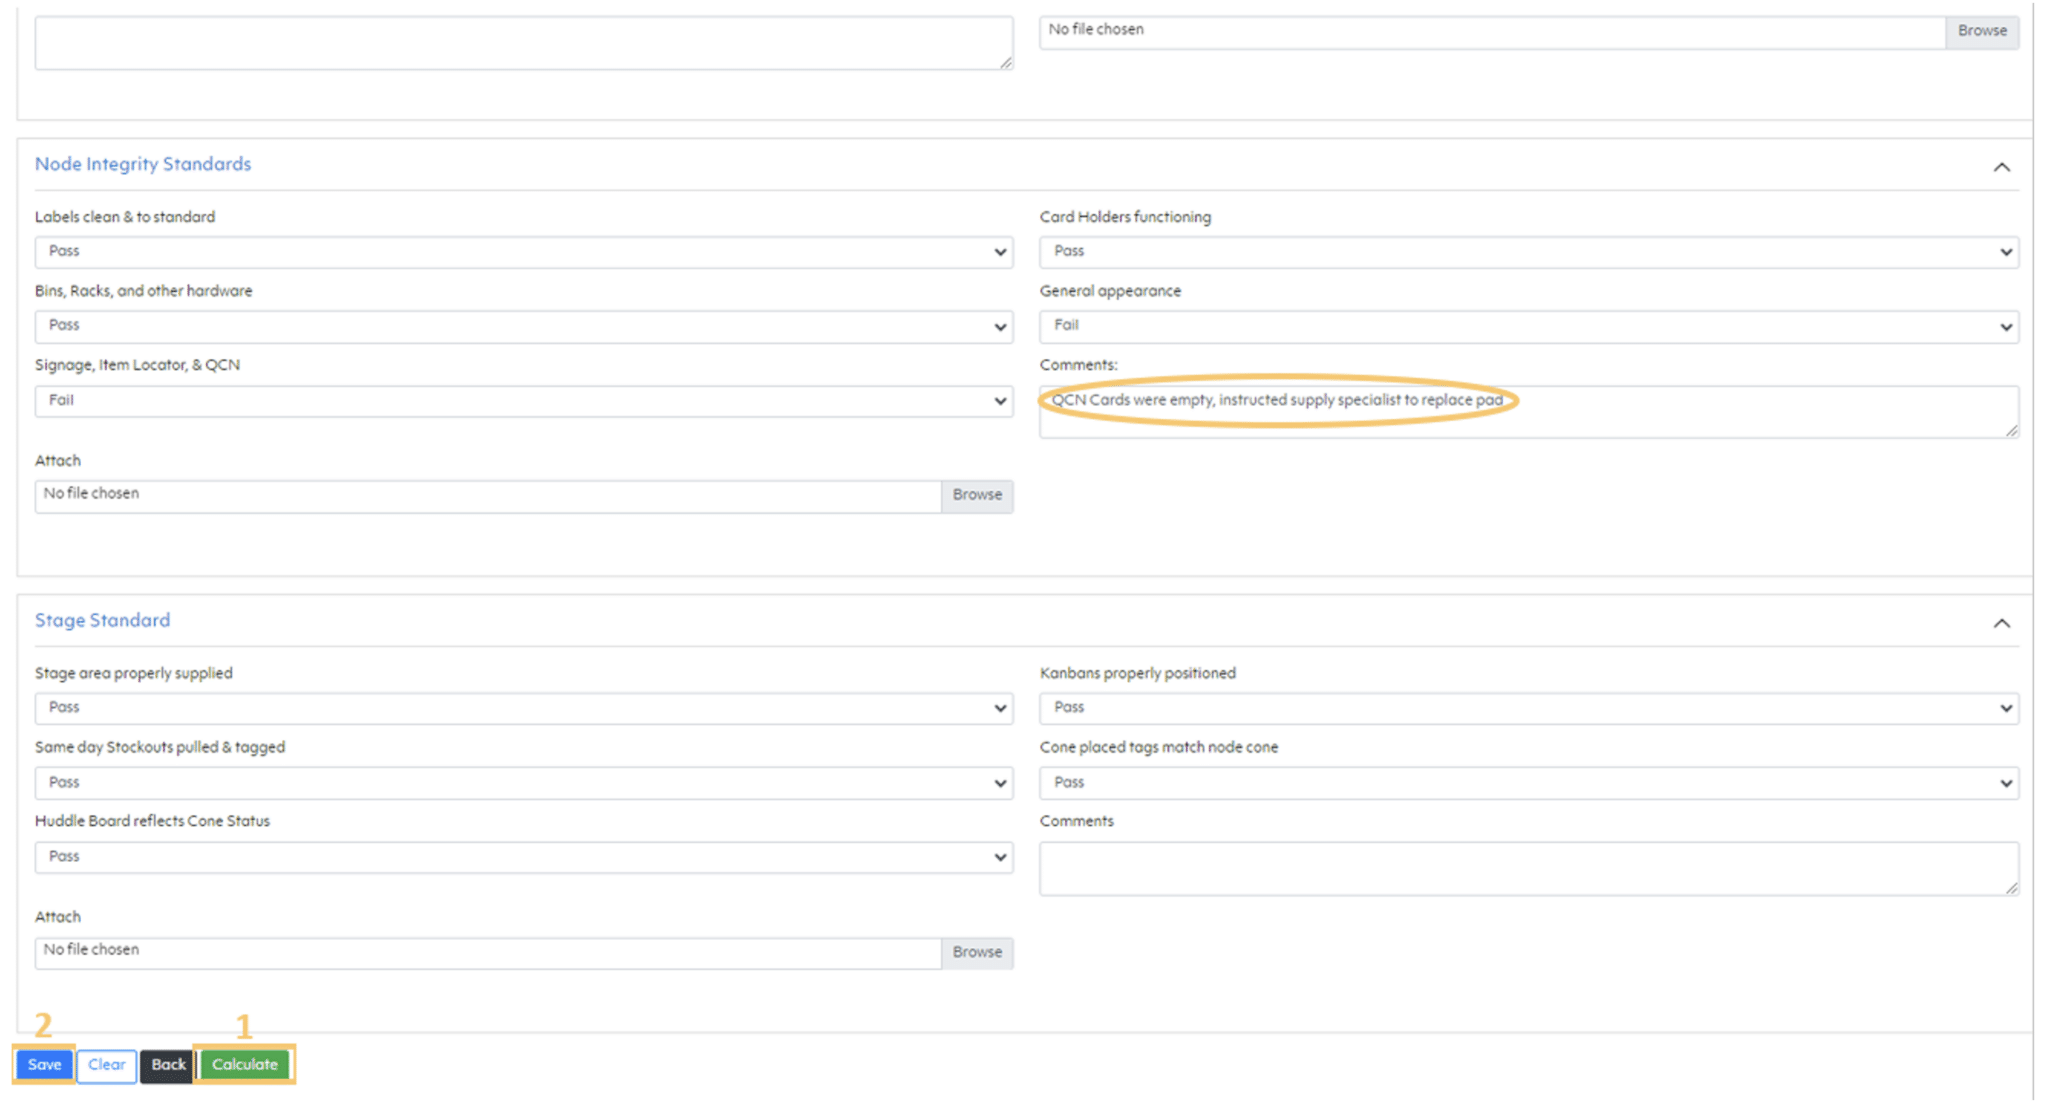
Fig. 3) New Gemba Audit form showing Save and Calculate buttons
Once you’ve filled out the form, you can click Calculate in the bottom left (Fig. 3, boxed with a yellow 1). This will give you the score for the audit in the top portion of the form. Finally, the last step is to save your audit (Fig. 3, boxed with a yellow 2). The Audit will now be added to your Gemba Audit Dashboard, which we will discuss next week!
BlueQ Tip #14: Using the Gemba Dashboard
As mentioned last week, we will explore parts of the Gemba Dashboard today. This is a succinct summary of the Gemba Audits being conducted within your organization.
The quickest way to get from the Main Dashboard is to click the Gemba Audit drop-down menu and select Gemba Dashboard. (Highlighted in the gold rectangle in fig. 1)
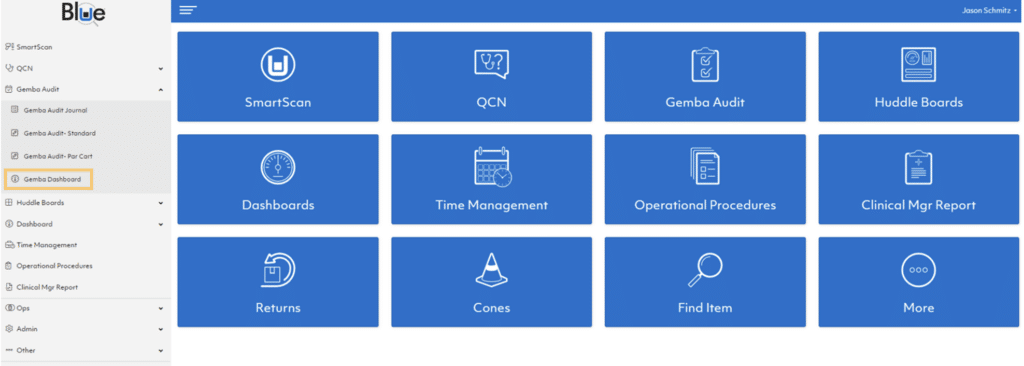
Fig. 1 - How to find the Gemba Dashboard in BlueQ
Below is a screenshot of the demo Gemba Audit Dashboard (fig 2). The dashboard can be further filtered down by Facility and Node Location using the drop-down menus in the gold rectangle. The Auditor drop-down can be used to filter audits conducted by certain individuals.
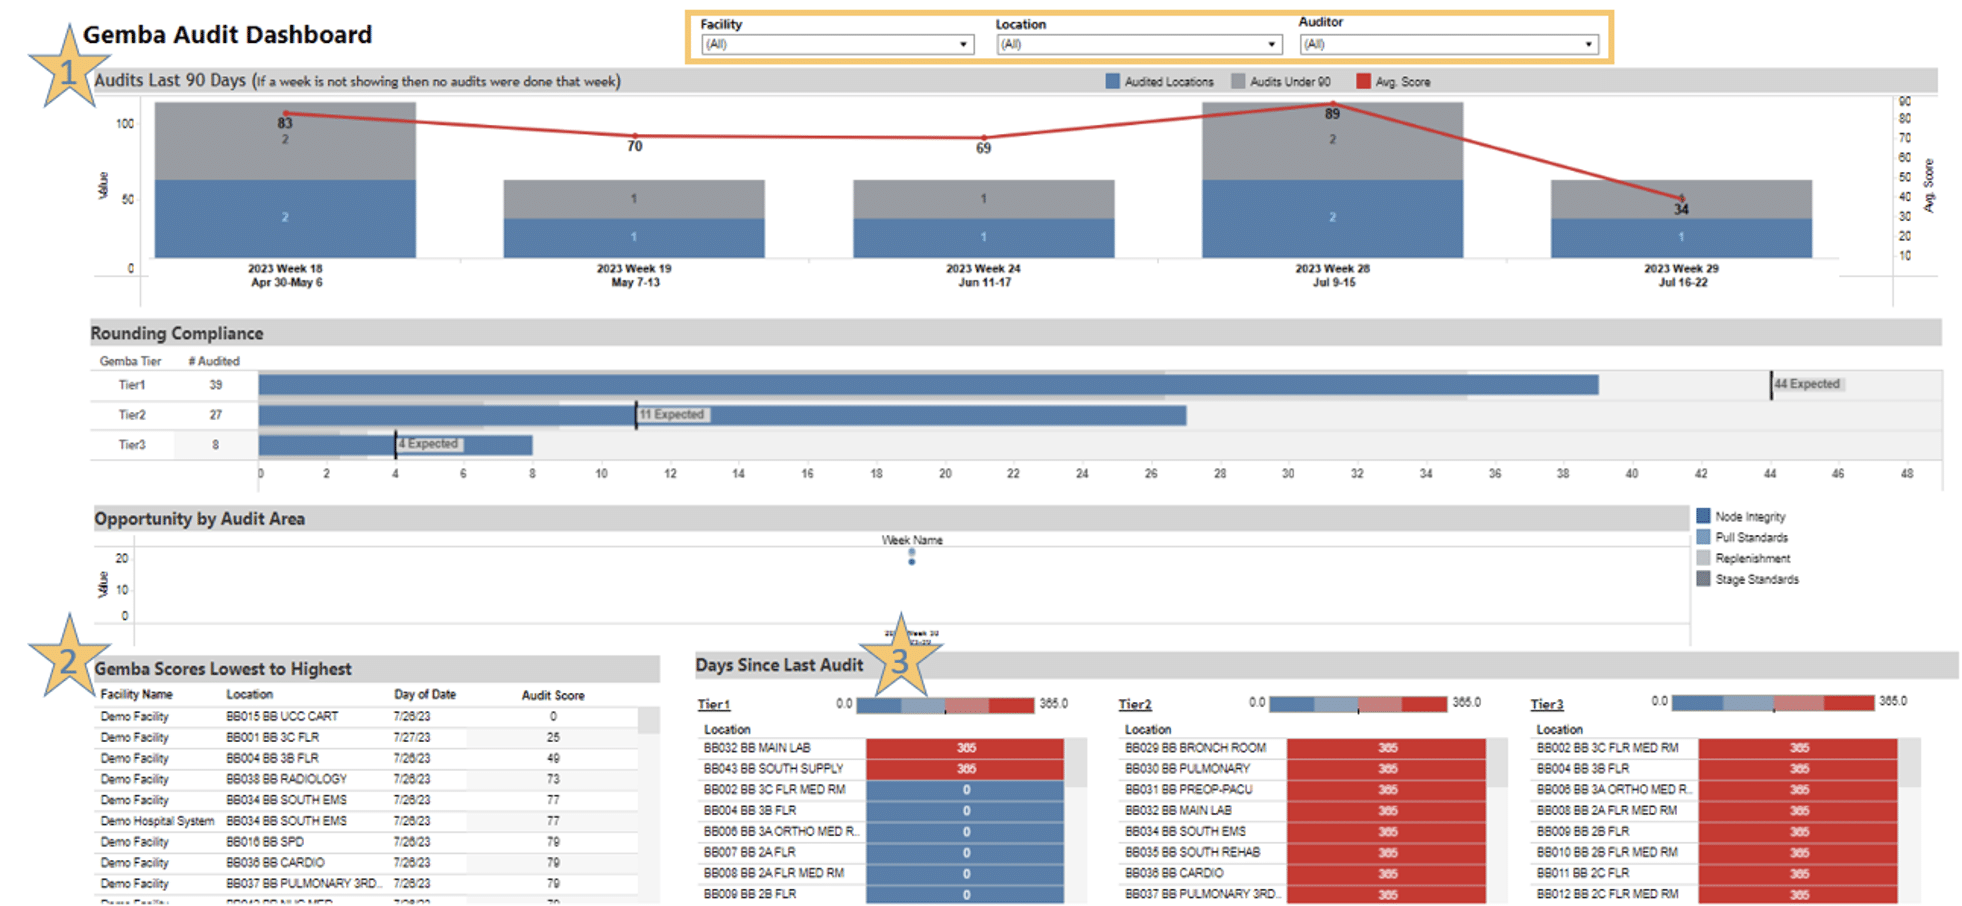
Fig 2. - Gemba Audit Dashboard in BlueQ
I’ve put stars next to three sections on the dashboard discussed today.
- Audits Last 90 Days: As described, this shows a summary of all audits conducted within the past three months. Any weeks where an audit was not conducted will not have a column in this view. The blue section of the column represents the total number of audits conducted that week. Above it is a gray section. This is the number of those audits that scored below 90. In this case, all audits have scored lower than 90, so the numbers are the same. The red bar across the top shows the average score for audits conducted that week and can show trends for how your nodes score.
- Gemba Scores Lowest to Highest: This window shows which nodes need the most assistance to function properly. It can be a great one-stop look for where you can improve your organization most efficiently.
- Days Since Last Audit: This view is broken down by the tiers (which were explained a few weeks ago). Individuals conducting audits can use this to determine which nodes they need to audit next.
Conducting regular Gemba Audits ensures your nodes will run at optimal efficiency, and allow clinical staff to locate supplies. This will also assist with maintaining order and a clean presentation. Remember, Gemba Audits are only as good as the effort, note-taking, and follow-through put into them!
Node Activity
We're excited to unveil the first of our BlueQ Video Series Tips, which will help you navigate the BlueQ Analytics dashboards and optimize your supply systems.
Today's tip features Jonathan Wilkins, one of our Program Managers in Colorado, discussing how to use the Node Activity Report to streamline your Supply Chain Management System. Enjoy!
Item Activity
Program Manager, Bodio Popoola speaks about optimizing your Supply Chain Management system using the Item Activity Dashboard.
Part 1
Part 2
Part 3
Item Velocity
Senior Program Manager, Joe Franklin, explains the Item Velocity Report.