
Hospital Supply Chain Case Study:
From Concept to Control Tower
How a Major Regional Multi-Hospital Health System Built a Supply Chain That Works at Scale
Key Takeaways
- Process discipline is the foundation. Technology amplifies it, not the other way around.
- Proving ROI at one site creates the flywheel for system-wide investment.
- Strategic capital requires demonstrating payback under two years.
- Transparency about the learning curve builds more durable leadership support than overselling the outcome.
- Supply chain data is not just an operations asset. It informs contracting, compliance, and clinical quality decisions.
- For health systems with decentralized reporting structures, this approach provides the accountability infrastructure that org charts alone cannot.
Introduction
A major regional multi-hospital health system operating 17 hospitals and more than 80 care sites in a large metropolitan market, with more than $1.3 billion in annual supply spend, including approximately $500 million in pharmacy.
The SVP of Supply Chain Management and Operations overseeing this transformation brings more than 30 years of healthcare supply chain experience, including successful BlueBin implementations at two prior health systems, prior to bringing the program to this organization.
A structural challenge defined the environment from the start: hospital-level materials managers reported to local hospital administrators rather than to the system supply chain. That meant accountability, visibility, and consistency across 17 hospitals required more than better processes. It required a system that made performance visible and impossible to ignore.
Results at a Glance
Supply expense reduction, Pilot OR Facility
Additional opportunity identified via BlueQ
System-wide supply expense run rate
Legacy ADC lease costs eliminated per OR facility
Phases 5 and 6 investment committed
Results at a Glance
One-time inventory reduction, Pilot OR Facility
Payback period, Pilot OR Facility
OR put-back rate reduction
ROI, Pilot OR Facility (3-year projection)
Facilities in Phases 5–6
The Challenge
Before BlueBin, the health system had four separate replenishment systems running across its hospitals with limited integration between them. In procedural areas, legacy automated dispensing cabinets (ADCs) had been in place for more than 20 years. At the Pilot OR Facility alone, lease and service costs on those cabinets ran approximately $100K per year.
The more fundamental problem was hidden in plain sight: clinical staff were managing roughly 80% of the system’s supply costs without supply chain oversight or visibility. Preference card inaccuracies were driving a 40% put-back rate at the Pilot OR Facility, meaning nearly half of all supplies pulled for a procedure were never used and had to be returned. Stale inventory accumulated undetected. Critical items ran short while unnecessary stock piled up.
At the administrative level, the early warning system was almost nonexistent.
Everyone’s answer was, “My phone doesn’t ring,” or “If my phone rings, that’s how I know.” And it’s like, oh boy, we got a lot of work to do.
The root cause wasn’t poor intent. It was the lack of infrastructure that prevented supply chain performance from being visible to the people responsible for it.

Why BlueBin, and Why Now?
The inflection point came from an unexpected direction. The COO at the Pilot OR Facility reached out, seeking a consultant recommendation to improve the OR supply flow. The SVP redirected that conversation toward BlueBin’s process-led approach.
What followed wasn’t a sales pitch. It was a three-day workflow mapping session with the COO in the room, building organizational alignment before a single capital dollar was committed. The SVP’s conviction stemmed from personal experience: he had successfully implemented BlueBin at two prior health systems and understood what the methodology could accomplish when leadership was aligned from the start.
The internal reclassification of BlueBin from routine to strategic capital was the next critical win. The framing mattered: this wasn’t a supply room upgrade. It was a transformation of how the health system managed nearly 80% of its supply costs.
You’ve got supply chain professionals micromanaging 20% of the cost, and you’ve got non-supply chain professionals managing 80% of the cost. And this Kanban system is predicated on flipping that conversation.
The timing of an ongoing Epic migration also played a role. Rather than treating the EHR transition as a barrier, the team recognized it as an accelerant: a natural moment to eliminate legacy ADC infrastructure, simplify charge capture, and enable post-case supply returns within 24 hours instead of the 2 to 4 days the old system required.
The underlying philosophy, as the SVP stated directly: “Kanban is a verb, not a noun.” The point was never the bins. The point was a fundamentally different way of managing the majority of supply costs.

The Implementation Journey
A Phased Approach
The sequencing was deliberate. Four years were spent building proof in acute care settings (Phases 1 through 4) before entering higher-complexity procedural areas. That sequence was strategic: it built institutional credibility and produced data at a scale that hospital leadership could not dismiss.
The Pilot OR Facility became the beta site for procedural expansion. A secondary OR facility ran as a parallel proof of concept. A major academic medical center campus began an acute care rollout that would eventually span 191 nodes.
Implementation Mechanics
The implementation went deeper than most supply chain programs dare. The team applied a Plan for Every Part (PFEP) approach and ran preference card cleanup in parallel with Kanban implementation. They also did something that few health systems have the organizational will to do: they brought the shadow supply chain under formal supply chain management.
At the Pilot OR Facility, 1,194 items that clinical staff had been managing independently were brought into the supply chain system. At the secondary facility, 469 more. This is where real visibility and control were actually established: not by controlling what the supply chain already managed, but by claiming what it had never managed before.
To make accountability stick in a dotted-line reporting structure, the team restructured job descriptions for hospital-level materials leaders and embedded BlueBin performance metrics directly into annual performance evaluations.
Change Management
Resistance was predictable, planned for, and addressed honestly. Leadership was informed of the temporary increase in supply expenses and resource demand before implementation began, not after. The philosophy applied here: make the current state visible to hospital leadership before proposing the future state. Momentum shifted when the Pilot OR Facility results became undeniable. Early skeptics became internal champions.
You have to tell them the good, the bad, the ugly, and then the beautiful once you get to it. Always, always, always tell them the truth.
That transparency wasn’t a risk to the program. It was the foundation of the leadership support that sustained it.

Results
Pilot OR Facility
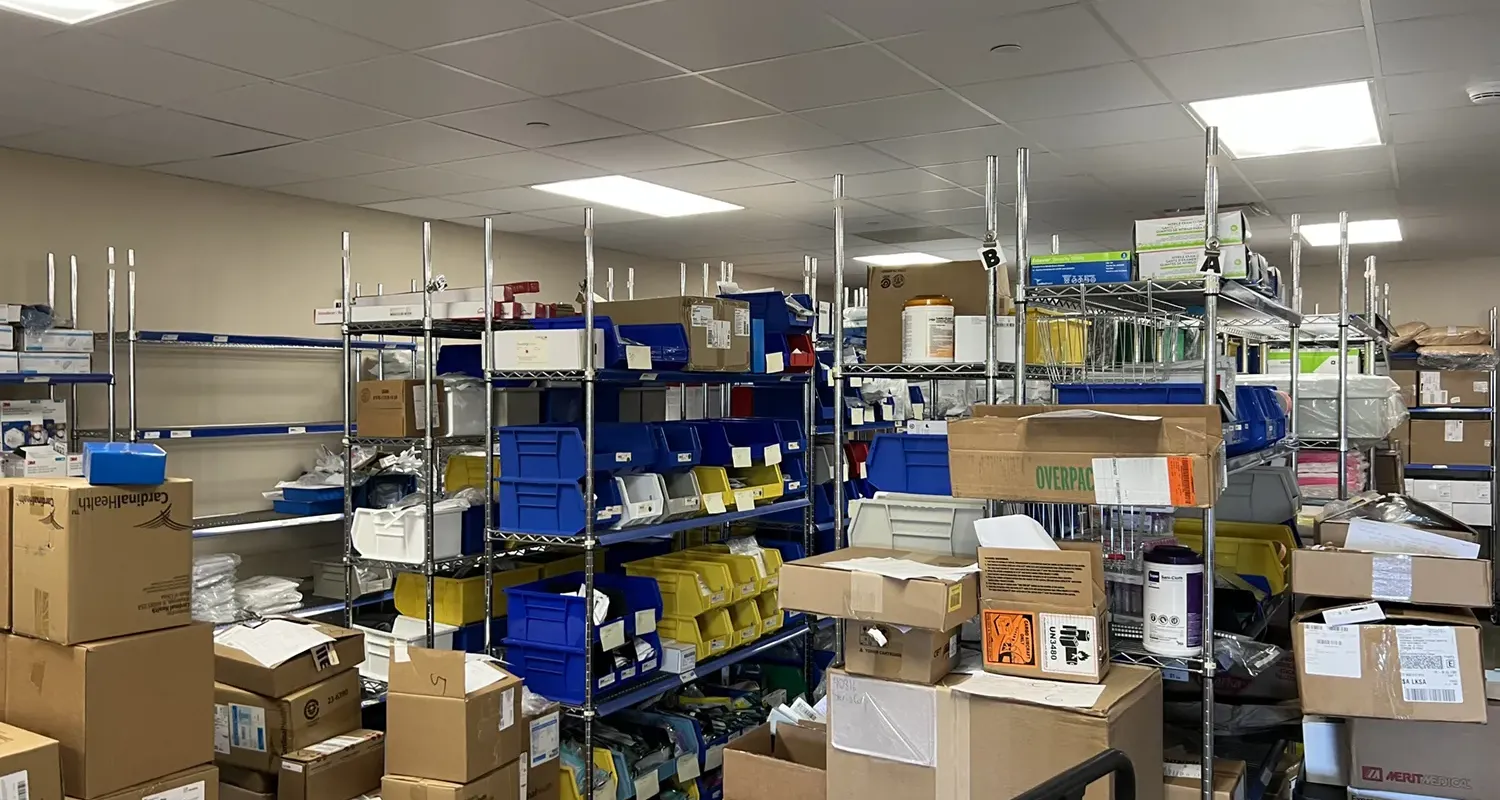
The Pilot OR Facility results set the standard for everything that followed. 58 supply nodes were transitioned (consolidated from 63). Net managed items were reduced 15%, and holding costs fell 2%, reflecting right-sizing rather than indiscriminate cutting.
The $1.51M one-time inventory reduction was realized immediately, with an additional $4.39M in opportunity identified through BlueQ Analytics. Supply expense fell 12% on total expense, 17% per budget stat, and 14% per case. Annualized savings ranged from $7.08M to $9.79M, depending on the measurement basis. The OR put-back rate dropped from 40% to under 10%. Legacy ADC lease and service costs were eliminated, reducing $498K in fixed expenses per year. Payback was achieved in under one year, with a 3.4x ROI projected over three years.

We got our payback in less than a year. We’re going to actually go into the green this coming year. And this became the example for what we wanted to do system-wise.
Secondary OR Facility
At the secondary OR facility, the managed item count fell 56% before accounting for shadow supply additions. The net reduction after bringing previously untracked items into the system was 35%, and holding costs increased by 17% intentionally to include items that clinical staff had been sourcing independently. This is what appropriate inventory looks like: not simply less, but right.
Academic Medical Center Campus (Acute Care)
191 nodes were transitioned, resulting in a net 20% reduction in managed items and an 11% reduction in holding costs. BlueQ Analytics identified 8,801 slow and stale items across the campus, representing $1.34M in further reduction opportunity.
System-Wide
The current run rate is a 6% reduction in supply expenses against a 2% projected baseline. FTE impact, clinical satisfaction data, and cumulative savings totals across all sites are being documented and will be incorporated in the final published version.
From the clinical staff who use the system every day, the feedback is straightforward.
“I love the new system…the supplies are much more organized…easy to find when I’m in a hurry.”
— RN, Emergency Trauma Unit
“Smooth transition with the new system. We love the new design.”
— RN, Step-Down Care Unit

The Control Tower Vision
With proof established across acute care and two OR sites, the health system has committed $7.8M across Phases 5 and 6 to extend the transformation through OR, Cath Lab, IR, Endoscopy, Anesthesia, and EP areas across 8 or more additional facilities through FY28.
The financial projections for those phases reflect the compounding effect of infrastructure already in place. Phase 5 (FY27) carries an NPV of $9.98M with a payback period of 1.14 years. Phase 6 (FY28) projects an NPV of $32.66M with a payback period of just 0.49 years.
At any given time, I could call up on my screen and see how my supply chain is doing system-wide in terms of stockouts, hots, colds, stale items. And it’s leading directly to us being able to do a better job in all areas of supply chain because of our replenishment methodology.
The end state is not a better replenishment system. It is the supply chain as the single system of record for replenishment across every patient care area in the health system, with BlueQ data informing contracting decisions, value analysis, supplier performance, and new product evaluations in real time.
The goal the whole program has been building toward: supply chain professionals managing the majority of supply costs, with clinicians focused on care, and data driving every decision in between.
Ready To Get Started?
Contact us today to discuss your our 2-Bin Kanban systems and supply chain analytics for healthcare!