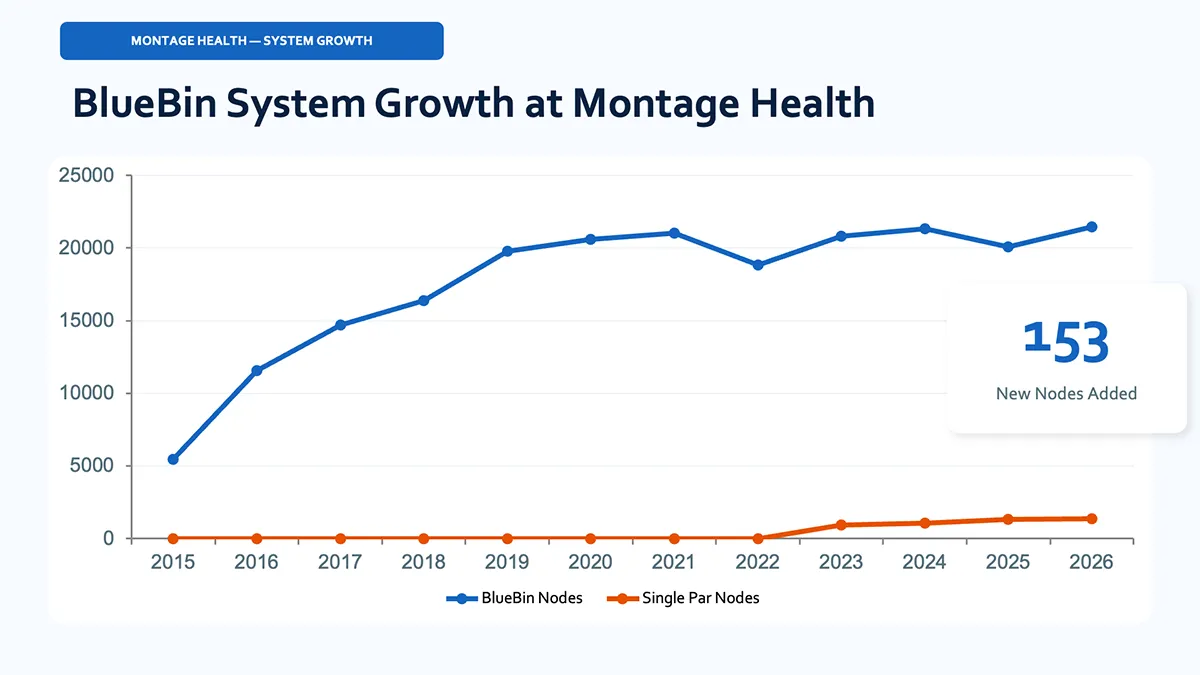
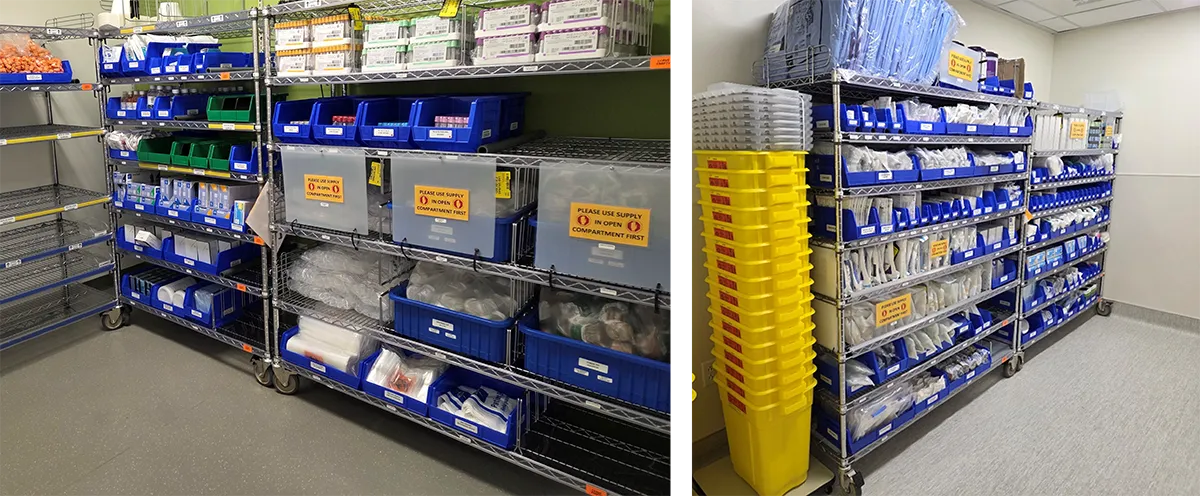
Welcome everyone. For today's discussion, I am here with Van and Rebecca from Montage Health. Together, these two represent a leadership team focused on operational excellence, clinical alignment, and continuous improvement. I am honored to be here with them today as we explore what it means to build supply chain success beyond the data. Today we will focus on three areas optimizing supply chain operations, the assessment and the implementation. And finally the road ahead. Were Van and Rebecca will share their perspectives, lessons learned, and their ongoing initiatives to optimize their supply chain systems. As we share our partnership in our journey today, it's important to remember that none of this would be possible without remembering what the lean culture teaches us. The first is simple. Improvement is everyone's job. Continuous improvement cannot belong to one department, one leader, or one person. It has to be something we all own. When everyone is empowered to identify problems, challenge the status quo and contribute ideas, we ultimately succeed. The second is looking for talent. Even at every level, including leadership. The people with the most information are the ones closest to the work. They know where the waste is. They know where the frustration lies, and most often times than not, already have thought of an idea on how to fix it. Therefore, it's important to create an environment where ideas are heard, encouraged, and acted upon. Because who knows, you might have superstars on your team right now, but they haven't been given an opportunity to shine. And finally, take every opportunity you are given to participate in continuous improvement. Don't wait for the perfect process. Don't wait until you have all the answers, because waiting for perfection can stall success. Lean teaches us that improvement is a journey. We test, we learn, and we adjust, and then we improve again. Sometimes the first version isn't the best version, and that's okay, because the goal isn't perfection on day one. The goal is to be better than we were yesterday, and that's what our journey to optimize is really about. Our journey brings people, processes, and partnerships together with the common goal of identifying opportunities, eliminating waste, and creating meaningful, sustainable improvement. Because when improvement becomes everyone's responsibility, when we recognize talent already within our teams, and when we act, rather than waiting for perfection, continuous improvement becomes more than just tools, practices, and methodologies. It becomes a culture. So how do we take these lean principles and turn them into something that actually works within a supply chain environment? Well, that's where BlueBin comes into the game. We believe Kanban is a best in class approach to optimizing supply chain systems, because it takes principles of lean and translates them into practical, repeatable ways of managing inventory and workflow. Kanban simply isn't just labeling bins and scanning barcodes to replenish stock. Kanban is an integrated system, and for that system to be successful, you need reliable pillars supporting it. The first is standard work. Standardization creates predictability, reduces variation, and makes it easier to identify when something isn't working the way it should. Even the best processes or technologies are only as effective as the people using it. Our teams need to understand not just what they are doing, but why they are doing it. Because that full understanding establishes ownership. The second is visibility. You can't optimize what you can't see through. Our analytics partners are able to turn supply chain activity into meaningful information. This knowledge helps partners identify trends, uncover opportunities, and make decisions based on facts and feedback rather than guessing. Visibility tools like our daily management system can help teams make key, informed decisions about their supply chain systems, which ultimately translates into the last pillar of success, which is cost savings. When you bring the pieces of standard work and visibility together, you create something much more than inventory management. You create a sustainable supply chain program. Before optimization, you must first stabilize. Most stable supply chain systems, promote standard work through standard operating procedures. Reliable data collection engage staff who are trained on standards of work to be performed, waste reduction practices, supplier reliability, and accountability, and clear communication pathways between supply chain and clinical staff. Without stability, continuous improvement efforts become reactive, which can alter one's supply chain experience. Lack of stability can result in stock outs, over stocking, staff frustration, poor vendor performance, inconsistent data, increased costs, operational efficiencies, and patient care risks. Lean initiatives create a shared baseline so that improvement is possible, measurable and scalable. Without these methodologies in place, data loses its true meaning. At the center of lean is the elimination of waste, also known as downtime. In healthcare supply chain, these eight forms of waste directly affect cost, efficiency, and patient care. That is where Kanban and its systems matter most because they create visual control, reduce variation, and eliminate unnecessary movement in the system. Understanding one supply chain operation begins with performing an assessment, along with structuring a plan for implementation. To execute this, we must begin with mapping the current state of operations. Every transformation begins with understanding reality. By mapping the current state, we can get a better understanding of how materials move, how information flows, where delays occur, and where breakdowns exist. It is vital that we never assume, but rather we observe and report, because improvement cannot be built on perception. It must be built on facts. Next, we collect usage data. Sometimes it comes from systems. Sometimes it must be gathered manually. Either way, the goal is the same. Understanding true consumption behavior, even in perfect data, is valuable when it reveals patterns that were previously invisible. This is where we can begin to connect behavior to data and data to decision-making With visibility established into pain points, we identify breakdowns such as stock outs, excess inventory, workflow inefficiencies, communication gaps, and process delays. These are not just operational issues, they are signals of a system design error. And once we see them clearly, we can begin to fix them at the source. No system can be understood without getting to know the people who use it. We are proactive in engaging in conversations with supply chain teams, clinical staff members, department leaders, and support services staff members. These conversations reveal what data alone cannot, which is how the system actually behaves when it's in practice. The most important insights are often not in reports, but rather in the experience. Collaboration and alignment across teams ultimately transforms data into a shared understanding. This can be seen through visibility tools we provide, like our daily management system, which empowers organizations to monitor performance daily, identify issues in real time, maintain accountability, support continuous improvement, and drive consistent communication. The analytics, along with the daily management system, are the connecting factors between strategy and execution. It also ensures improvement is not periodic, but rather daily, structured, and sustained. When the goals are aligned between departments, communication improves, friction decreases, and performance accelerates. Montage Health and BlueBin have partnered for over a decade to drive supply chain transformation. Together we have focused on reducing waste, improving efficiencies, increasing visibility, strengthening clinical alignment, and building sustainable systems. But the real story is not the system. It's the journey. At this point, I'd like to turn it over to the Montage Health team, who will share the operational perspective from their point of view and how they are building their supply chain successes beyond the data. Morning, everyone. I'm Van Le and this is Rebecca Interrante. We're from Montage Health, located in Monterey, California. We have a community hospital that's supported by a broad family of health care services throughout our area. And together, Rebecca and I bring a combined 21 years of healthcare experience. My goodness, how time flies. Thank you for having us. We appreciate the opportunity to share our BlueBin journey and some of the lessons we learned along the way since 2015. We'll cover a bit of the size of our program, how we opted to design our supply nodes, how we manage requests, as well as how we utilize analytics to guide ongoing optimizations. So as mentioned, our journey started back in 2013. Before that, we were using an old PAR Ex system along with a 1989 version of Lawson. For anyone familiar with the old PAR Ex system, we were using little metal probes and wand, parallel to Lawson, for depleting inventory transactions. Good times. It worked. It just required several manual steps. Today, we currently manage 153 BlueBin supply nodes, 122 of them being at the hospital with 31 across several off sites. Altogether, that's more than 24,000 bins, and the program continues to expand. All our PAR replenishment is completed using handhelds while rounding on the units, and specifically we use TC 78s. For sourcing, we do have a hybrid model. Most of our bins are sourced via LUM from Medline, but of course we have the traditional from inventory, other distributors or direct from manufacturer as applicable. Really just depends on usage and purchaseable unit of measures. At the hospital, we have two central supply techs that start scanning at 4 a.m., typically finishing by 7:30 a.m. Transactions are processed within a very short window and pick tickets print as routing is completed. We also recently transitioned from Lawson to Workday, and we were able to integrate directly with BlueBin with workday through a combination of APIs and flat files. It required a lot of planning, but it allowed us to maintain the same operational workflow. With over 24,000 bins, we really didn't want to have to update any labels, and we didn't have to. So it worked out. Most of our locations use a two-bin system, and you can notice that you'll see that on the blue graph there in the blue line. However, we do have a few single bin locations due to space constraints, and our goal is actually to convert those over to a two bin system by the end of this year. Like many other organizations, we have limited space and we have to get creative with room layouts, product sizing, and determining which products are truly necessary. So about five years into the program, we revised our standards for determining which products should be managed through the program. By that point, we had already addressed most of the goods squirreled away throughout the units and established strong clinical champions. Our clinical champions saw how much time was saved with this two bin system, and requests just started pouring in. The enthusiasm was extremely valuable, however, they ended up wanting everything and anything added. So, our next challenge was then separating personal preference from actual clinical need. Not every product had enough usage to justify being managed by us in supply chain, so we end up establishing a guideline that products generally shouldn't be added to the program unless it was purchased at least once a quarter. Now, that didn't mean they couldn't have items that didn't meet that criteria within their supply closet. It just meant we would create a space for them and they would manage it. And so far, it's been a good compromise since most of the items, if not all of those items, have had extremely low usage. We also improved our approach to PAR adjustments. We already had reports estimating optimal PAR levels, but really wanted an additional buffer against unexpected usage spikes. If an item had a double bin stock out within 30 days of our review, we doubled the PAR. Maybe didn't have a scan in more than 180 days, we pushed to remove it. And you can see some of the dips here on the graph. As we completed ongoing optimization projects and shortly after a major optimization project, Covid happened. The world shut down and we were sure glad we did what we could, when we could. So here's a couple of examples of one of our supply nodes in our family birth center. Our goal is to support three days of product per bin And since it's a two bin system, it enforces FIFO. However, not every product fits inside of a bin. So, for larger items, we divide the shelf into designated spaces and use yellow Kanban cards, and each card has a number that tells the supply techs when to scan. So, you can see a min number here. When it reaches that quantity or below, it triggers replenishment. For carded items, we do enforce FIFO. I'll reference the image to the left here, but these items move so quickly we didn't have to worry about it. But I do have an example in the next slide. Might have also noticed the orange paint that we have along the walls. As many of you I'm sure will aware, this is a visual for us for the 18 inches of clearance that are required by compliance to not block any sprinklers. On the image to the right, the very last cart against the wall, you'll notice some green items. And these are what we call non BlueBin items. These are identified with a label that clearly says non BlueBin supplies in front of a yellow slat. Again the department owns that. They manage that and we give them a space for it. So our goal is to make the space as intuitive as possible. Clinical staff should be able to walk in quickly, pull what's needed and get out. Here I have a couple of FIFO examples for carded items. We use a combination of sliders and flippers. We include signage on these that identify which section staff should pull from first. It's not an impenetrable wall, but it clearly indicates, please use supply in open compartment first, and it works. So on the image to the left we use a liner as a flipper. It blocks us access to the section that was most recently replenished. And then once the older inventory has been depleted, it moves to the opposite direction. So in this case, it just moves down. On the image to the right, we use an acrylic divider mounted on rails. The divider moves from left and right but serves the same purpose. These designs may vary depending on the product and available shelf space, but the purpose remains the same. Simple. Simple to use. I'm going to go over a few design designs that we had opted to go for. I have seen many other folks decide to put all this in a single bin. I'll just say it now, for us, we opted to have everything separated for legibility. And then you'll also notice, in case you're wondering, the barcodes that we use. It wasn't until recently we were able to opt to use QR codes. So, we are slowly transitioning for new builds to QR codes. Okay, so imagine a bin and we're going to rotate it clockwise. The front of the bin we have the clinical description plus ERP number. So our item number. That clinical clinical description is separate from the item description in the ERP. This is what we call a nurse friendly description. Most ERPs allow you to have multiple descriptions, so, you can consider this description two. Before we go live, the new item, we workshop with our clinical champions and we ask for their help and support making a name that everyone can recognize, so that it's easily identified across units. And then we also include our item number because sometimes communication can get mixed. When you have clinical folks trying to talk to supply chain on trying to hunt down supplies. So, we give them an easy avenue as to what item number we can reference to get on the same page as them. Also, it does help them with Epic, if they need to pull the item up. On the right side of the bin, we have a node name and sequence label. So, the sequence label is in in order of the first character being the letter F, that's the rack number four being the shelf. So, this is rack F, shelf four. Next two characters.; 70 is the position on the shelf. Seems like a high number, but it’s really easy to identify. And then the last three characters that 224 is bin size. We use the last three characters of the manufacturer number for the Ben size, and this really helps our Kanban specialist team easily identify bins for maintenance purposes. On the rear of the bin, we have that long barcode I mentioned, that includes the ERP number, bin letter. So, we have an A and B for track and rotation, as well as the assigned PAR. And then it does include the purchasable unit of measure for reference as well as nurse friendly description. And then on the last slide side of the bin, on the left side is the manufacturer number. We do require our techs to reference the manufacturer number before filling a bin, just to avoid human error. Now, as you can imagine, we have alternative products. We have substitutes coming in and out all the time. So when we are using an alternative product, either the center supply team or the Kanban specialist team will apply a substitute label, and that will trigger the tech to reference procurement material that we go over each morning. So each morning, we have a procurement huddle that lasts about five minutes. All that combined is what you see on our card items. And then as mentioned a little earlier, on the back of that card is the minimum amount that triggers replenishment. For scanning, we do have on every BlueBin cards for our supply nodes, we physically attach what we call smart sheets. And so this includes a QR code that you'll see on the right side of the header for the SmartScan application: company, location, and cost center. So, this is exactly how it's designed within the ERP, and we give them the capability of scanning that. It will populate all three fields, to avoid any human error. We also include the applicable reference materials. So, in this case you'll see CHOMP B7430 for the requesting location, as well as the cost center, just in case there's some technical difficulties. From there, our techs scan cards first and then bins. Afterwards. They scroll to the bottom of the page. They can hit save, and that process is the requisition, that then kicks over to our ERP. And again, all of this is done on a handheld, while in the units. So we have a few testimonials we'd like to share from our frontline staff from our FBC. We have a lead nurse, Kim Verigie. That was kind enough to say since implementing the two bin Kanban method, the supply room has become more organized, and supplies are easier to locate, allowing nurses to remain focused on patient care. Supplies are replenished more efficiently, reducing the need to retrieve items from other supply areas. The first in first out process has also helped decrease product waste, while supply quantities now more accurately reflect actual unit usage. In addition, items can be removed, replaced, or adjusted as needed, based on changing supply needs. Next, we do have a few offsite clinics. We call them MOGO, Montage on the go, and our Clinic Manager, Cherie Howard, was kind enough to say, I cannot say enough about how much I love the Kanban system. It has made a tremendous difference in the efficiency of our busy clinic. It keeps our supplies organized and ensures we have what we need, when we need it. The ability to adjust PAR levels helps reduce waste while preventing us from running out of essential items. The organization of the bins makes it easy for staff to quickly grab supplies and keep moving. In our fast paced environment, the Kanban system has streamlined our workflow and allows us to focus more on providing excellent patient care. And lastly, we have a Surgical Services Director, Sarah Collins, who was kind enough to say two bin Kanban has transformed the way we manage our supplies. The ease of use allows our clinical staff to focus on patient care, and less on supply ordering and management. Next, I'll turn it over to Rebecca to go over how we manage the program, a bit on resource management, as well as how we utilize some analytics for ongoing optimizations. Thanks, Van. Quick side note before we jump into some analytics. After ten years of implementing Kanban nodes across our organization, just last year, we decided to use the same methodology for our own build supplies. Here you can see some pictures from our warehouse work area, where we actually mock up and construct new nodes. We've created Kanban cards and implemented the two bin system for common supplies and equipment needed, for our own team to complete builds. On the left you can see some shelving, dividers, and ledges. And on the right you can see zip ties and plastic cards. When we need to replenish our own supplies, we simply just scan the bins and cards through SmartScan. Alrighty, back to our regularly scheduled program. This program is not static. Products change, clinical practices evolve, usage shifts, and departments regularly need adjustments. Our management process combines three main sources of information: 1. Requests from departments. 2. Analytics from BlueBin. And, 3. Our own internal project tracker. Department requests are currently submitted using this gold form here called a QCN. This stands for questions, comments, needs. If a department wants to add an item, remove an item, change a PAR level, relocate a product, or make another adjustment, QCN is the starting point. Each QCN requires approval from clinical leadership, helping ensure the request supports clinical workflow and patient care. It allows department leaders to understand and support the impact on space, inventory, and cost. It also creates accountability, and helps prevent conflicting requests for the same unit. We are piloting a digital version of QCN, but it isn't ready for the prime time quite yet. Until then, the physical form gives us a consistent method for documenting these requests. This graph shows the number of requests we've received, completed, and rejected by year. The volume varies, but much of the activity reflects strong clinical engagement and larger optimization projects. However, not every request is automatically approved. We evaluate usage, product standardization, available space, and whether the request represents a true operational need. When we do reject a request. We make sure to explain the reasoning and work with that department to identify another solution whenever possible. For example, an item with extremely low usage can remain available within the supply room, just not as a BlueBin item. It would be considered non BlueBin managed by the end user department. This helps us remain responsive to clinical needs while also protecting the overall integrity of the system. A common question we're asked is how many resources do you really need to complete ongoing maintenance? And of course, your mileage may vary. For our size and volume, we need at least two full time employees dedicated to BlueBin maintenance. Four really being the sweet spot. One of which is our Program Manager, and their direct reports, coined as Kanban Specialists. This graph is an example of our QCN progress by team member. Tracking this helps us understand our own productivity and capacity. It also gives us visibility into completed tasks and areas where additional support may be needed. The Program Manager provides consistency and accountability, while the Kanban Specialists provide us the ability to complete changes in a timely manner. Program maintenance isn't just QCNs and clinical requests. It's also auditing supply nodes, managing optimization projects, and much more. Our analytics show us how to proactively identify products that may require attention. Here we have an overview of an item breakdown report. The pie chart gives us a percentage of items by health category. We group items into five health categories: healthy, stale, slow, hot, and critical. Healthy items are rotating as intended. The scan frequency and the PAR level are aligned with the demand. Therefore, there's no immediate action required. Stale items, those haven't been scanned in 180 days or more, or six months. We push to remove these items from the PAR location altogether. With limited space, we need to prioritize higher demand items. Slow items haven't been scanned for 90 to 179 days. We typically aim to cut the current PAR level in half, at least, if the purchasable unit of measure allows it. Hot items are consumed within the shadow of their own lead time, simply meaning, the second bin would be close to depletion by the time replenishment for the first bin is done. Our goal is to increase the PAR by half of its current level. And then lastly, we have critical items. These have the highest risk of stock out. By the time we round the node, both bins would be depleted. Which we call a double bin stock out. These require immediate attention and prompts us to, at minimum, double the PAR level. Here you see our PMT for 2026. This is a very basic project tracker. Nothing fancy. The Excel table is maintained by our Program Manager, and it provides a clear roadmap of upcoming projects and their expected start and completion dates. We plan 12 months in advance and are usually fully booked with planned projects for over two years. However, our planning is flexible as unexpected needs always come up. So, we adjust based on urgency, clinical impact, and available resources. Although the table is simple, every project has an owner, a target date, and documented status. Our BlueBin journey has been a success because of our strong clinical partnerships, clear standards, dedicated team members, and reliable analytics. The program continues to evolve and we continue to learn. Thank you again for allowing us to share our experience, and we look forward to any questions we have here or offline.



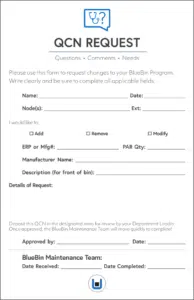 Change requests are submitted via a form Montage Health calls a QCN (Questions, Comments, Needs), which requires clinical leadership approval before an item is added, removed, or adjusted. That approval step protects space, cost, and inventory integrity while keeping departments accountable, and Montage Health tracks QCN volume, completion, and rejection by year and by team member to understand both clinical demand and internal team capacity. A digital version of the QCN is in pilot but not yet ready for full rollout.